June 22, 2026 a 03:15 pm
PFE: Fibonacci Analysis - Pfizer Inc.
Pfizer Inc. has demonstrated a recovery from its recent lows, showcasing potential upward momentum over the past few months. As a key player in the biopharmaceutical industry, its future growth is significantly tied to its innovative drug pipeline and vaccine success. Investors should be vigilant about its competitive positioning and regulatory developments that may impact its stock performance.
Fibonacci Analysis
| Attribute | Details |
|---|---|
| Trend Start Date | 2025-09-29 |
| Trend End Date | 2026-06-22 |
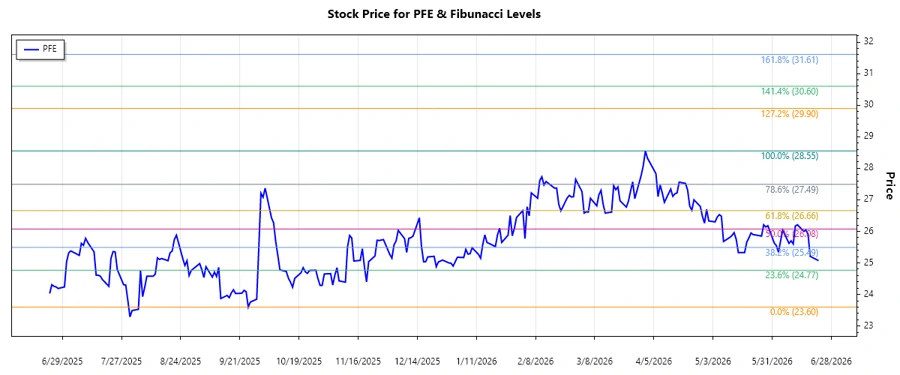
| High Point Price (Date) | $28.55 (2026-04-01) |
| Low Point Price (Date) | $23.60 (2025-09-25) |
| Fibonacci Level | Price |
|---|---|
| 0.236 | $24.83 |
| 0.382 | $25.66 |
| 0.5 | $26.08 |
| 0.618 | $26.50 |
| 0.786 | $27.12 |
Currently, the price is at $25.07, which places it within the 0.236 retracement zone. This suggests a potential support level around this area, but caution is advised for further price declines if this support doesn't hold.
Conclusion
Pfizer's recent stock performance indicates a cautious optimism, with Fibonacci retracement levels providing potential support and resistance areas. While the stock has potential upside given its strong market position and innovative product pipeline, risks such as regulatory challenges and market competition remain. Analysts should closely monitor Pfizer's progress in emerging markets and its collaborations, which might significantly influence its valuation.
Smart Data Insight
Master the Perfect Entry & Exit for this Stock
Don't leave your profits to chance. Historically, this stock follows specific seasonal patterns that institutional traders use to maximize returns.
- ✅ Identify the "Golden Buying Window"
- ✅ Avoid high-risk correction cycles
- ✅ Backtested data from the last 20+ years