December 06, 2025 a 03:31 pm

PFE: Dividend Analysis - Pfizer Inc.
Pfizer Inc. exemplifies a reliable dividend-paying stock within the pharmaceutical sector. With an impressive record of sustaining dividend payments over 54 years, its historical performance underscores stability. Investors attracted to steady income streams may find Pfizer's current dividend yield attractive, despite the relatively high payout ratio indicating potential constraints on future dividend growth.
📊 Overview
Pfizer, as a major player in the pharmaceutical sector, offers investors a robust dividend yield of 7.04%. This high yield, combined with a solid history of consistent dividend payments over 54 years, shows its dedication to rewarding shareholders. However, potential investors should be aware of the last cut in 2010, emphasizing the need for vigilance regarding potential future changes.
| Metric | Value |
|---|---|
| Sector | Pharmaceuticals |
| Dividend yield | 7.04 % |
| Current dividend per share | $1.68 USD |
| Dividend history | 54 years |
| Last cut or suspension | 2010 |
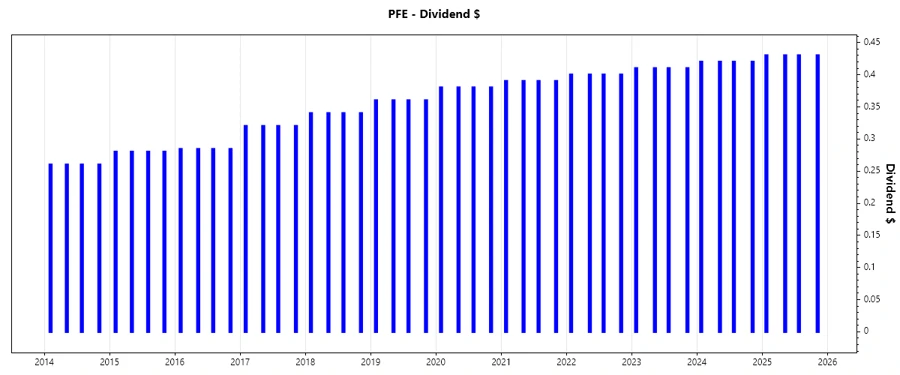
📈 Dividend History
The stability in Pfizer’s dividend history is notable, with consistent increases over the years, illustrating its commitment to returning capital to shareholders. This is crucial for investors relying on income generation through dividends. The last cut over a decade ago provides a level of confidence despite the current high payout ratios.
| Year | Dividend Per Share (USD) |
|---|---|
| 2025 | $1.72 |
| 2024 | $1.68 |
| 2023 | $1.64 |
| 2022 | $1.60 |
| 2021 | $1.56 |
💹 Dividend Growth
Pfizer's dividend growth over three and five-year periods shows consistent though modest increases, reflecting a measured approach to expanding dividends. This slow growth could appeal to long-term investors seeking stable income. The average dividend growth is 3.13% over 5 years, signaling steady albeit moderate enhancement in shareholder returns.
| Time | Growth |
|---|---|
| 3 years | 2.50 % |
| 5 years | 3.13 % |
🧮 Payout Ratio
The payout ratios, at 97.21% based on EPS and 92.02% on free cash flow, indicate that nearly all earnings and a significant portion of cash flows are directed to dividends. While this high payout supports current yields, it may limit dividend growth or pose risks in economic downturns, suggesting caution for potential volatility in future payouts.
| Key Figure | Ratio |
|---|---|
| EPS-based | 97.21 % |
| Free Cash Flow-based | 92.02 % |
💰 Cashflow & Capital Efficiency
Understanding Pfizer's capital efficiency through metrics such as free cash flow yield and CAPEX to operating cash flow ratio is invaluable for gauging the company’s financial health. The 2023 free cash flow yield improved slightly at 6.55% compared to the previous year. Despite a high CAPEX ratio, the sector's need for R&D and operational investment rationalizes this.
| Metric | 2024 | 2023 | 2022 |
|---|---|---|---|
| Free Cash Flow Yield | 6.55% | 2.95% | 9.06% |
| Earnings Yield | 5.34% | 1.31% | 10.91% |
| CAPEX to Operating Cash Flow | 22.83% | 44.91% | 11.06% |
| Stock-based Compensation to Revenue | 1.38% | 0.88% | 0.87% |
| Free Cash Flow / Operating Cash Flow Ratio | 77.17% | 55.09% | 88.94% |
📊 Balance Sheet & Leverage Analysis
Pfizer’s leverage metrics, including the Debt-to-Equity ratio and Net Debt to EBITDA, underpin the analysis of its long-term financial health and risks. The consistent Debt-to-Equity ratio below 1 reflects a balanced approach to leveraging and financial prudence.
| Metric | 2024 | 2023 | 2022 |
|---|---|---|---|
| Debt-to-Equity | 0.76 | 0.80 | 0.36 |
| Debt-to-Assets | 0.31 | 0.31 | 0.18 |
| Net Debt to EBITDA | 3.64 | 7.11 | 0.84 |
| Current Ratio | 1.17 | 0.91 | 1.22 |
| Quick Ratio | 0.92 | 0.69 | 1.00 |
🗣️ Fundamental Strength & Profitability
Fundamental strength, captured by Return on Equity and Net Margin, reveals Pfizer’s ability to generate profit from its equity base. The higher margins in 2022 compared to the subsequent years reflect periods of heightened product profitability or efficiency.
| Metric | 2024 | 2023 | 2022 |
|---|---|---|---|
| Return on Equity | 9.09% | 2.40% | 32.79% |
| Net Profit Margin | 12.60% | 3.58% | 31.26% |
| EBIT Margin | 17.47% | 5.49% | 35.85% |
| EBITDA Margin | 28.48% | 16.05% | 40.90% |
| Research & Development to Revenue | 16.88% | 17.76% | 11.39% |
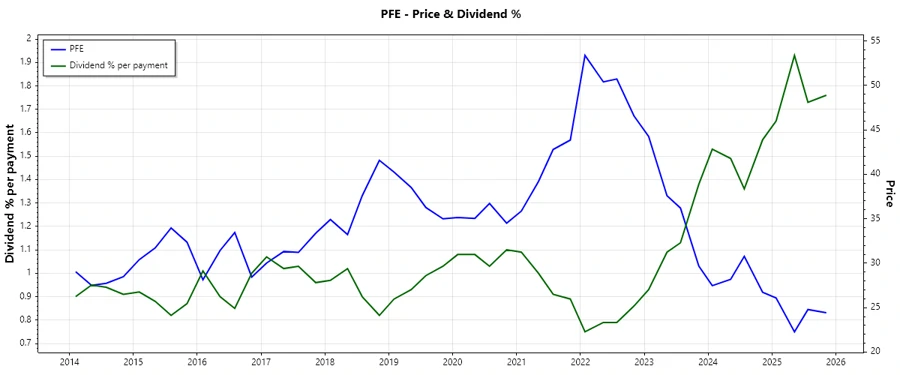
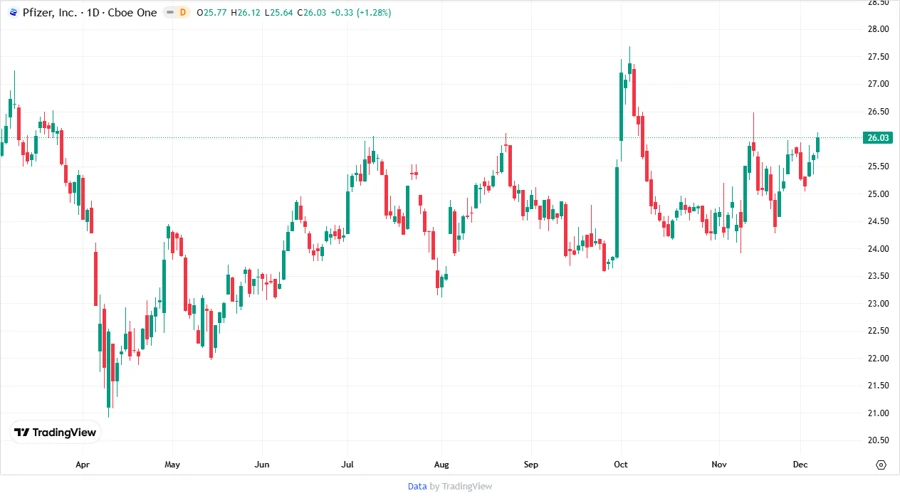
📉 Price Development
✅ Dividend Scoring System
| Category | Score | Bar |
|---|---|---|
| Dividend yield | 5 | |
| Dividend Stability | 4 | |
| Dividend growth | 3 | |
| Payout ratio | 2 | |
| Financial stability | 3 | |
| Dividend continuity | 4 | |
| Cashflow Coverage | 3 | |
| Balance Sheet Quality | 3 |
Overall Score: 27/40
🗣️ Rating
Pfizer Inc. is rated as a reliable income-generating stock with a strong dividend history and yield. However, given the elevated payout ratios, careful monitoring is advised. While the company's financial metrics suggest stability, the moderation in dividend growth and potential volatility in profits necessitate a cautious but optimistic outlook for dividend-focused investors.