November 14, 2025 a 03:31 am


PFE: Dividend Analysis - Pfizer Inc.
Pfizer Inc. presents a robust dividend profile with a long history of payment continuity. Though faced with some challenges in recent years, its commitment to dividends remains strong. Investors should note its high payout ratio, which, while sustainable for now, could be a concern if earnings fluctuate. The steady growth and resilience of dividends over decades highlight Pfizer's dedication to returning value to shareholders.
📊 Overview
📊 The following table provides an essential snapshot of Pfizer's dividend profile.
| Sector | Dividend Yield | Current Dividend/Share | Dividend History | Last Cut/Suspension |
|---|---|---|---|---|
| Pharmaceuticals | 7.04 % | 1.68 USD | 54 years | 2010 |
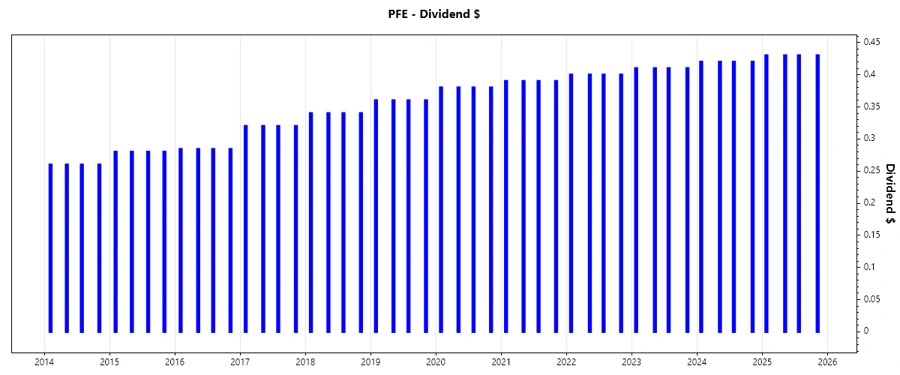
🗣️ Dividend History
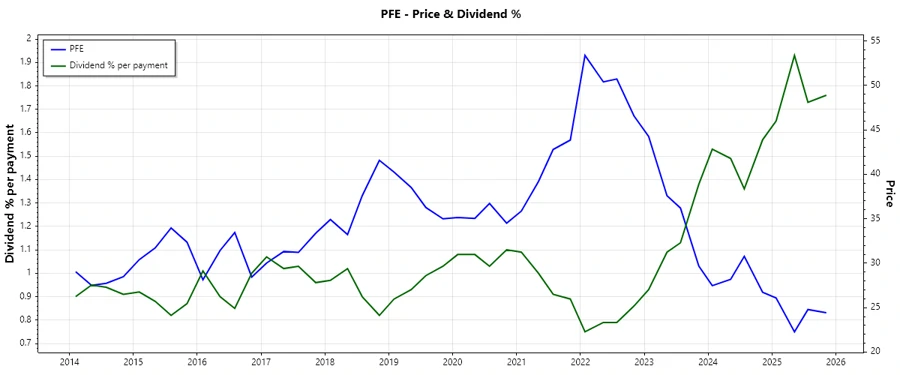
📉 Pfizer's extensive dividend history signifies stability and reliability, appealing to long-term income-focused investors. Its uninterrupted payment over 54 years reflects the company's robust financial health and commitment to its shareholders.
| Year | Dividend/Share |
|---|---|
| 2025 | 1.72 |
| 2024 | 1.68 |
| 2023 | 1.64 |
| 2022 | 1.60 |
| 2021 | 1.56 |
📈 Dividend Growth
📈 The growth of dividends is a strong indicator of a company's ability to increase returns to shareholders over time. Pfizer shows a modest increase in dividend growth rates.
| Time | Growth |
|---|---|
| 3 Years | 2.50 % |
| 5 Years | 3.13 % |
The average dividend growth is 3.13 % over 5 years. This shows moderate but steady dividend growth.
✅ Payout Ratio
📈 The payout ratio represents the proportion of earnings a company uses to pay dividends. Pfizer's current EPS and Free Cash Flow-based payout ratios are notable.
| Key Figure | Ratio |
|---|---|
| EPS-based | 97.21 % |
| Free Cash Flow-based | 92.02 % |
With the EPS-based payout ratio at 97.21 % and the FCF-based ratio at 92.02 %, Pfizer is distributing a substantial portion of its earnings and cash flow as dividends.
Cashflow & Capital Efficiency
📉 Cashflow metrics and capital efficiency ratios are critical in evaluating a company's operational success and sustainability of dividends. Below is the analysis for recent years.
| Metric | 2024 | 2023 | 2022 |
|---|---|---|---|
| Free Cash Flow Yield | 6.54 % | 2.95 % | 9.06 % |
| Earnings Yield | 5.34 % | 1.31 % | 10.92 % |
| CAPEX to Operating Cash Flow | 22.83 % | 44.91 % | 11.06 % |
| Stock-based Compensation to Revenue | 1.38 % | 0.88 % | 0.87 % |
| Free Cash Flow / Operating Cash Flow Ratio | 77.17 % | 55.09 % | 88.94 % |
Pfizer's cash flow quality is robust, though a high CAPEX relative to Operating Cash Flow in recent years may indicate heavy reinvestments or acquisition strategies.
Balance Sheet & Leverage Analysis
⚠️ A balance sheet analysis provides insights into financial stability and risk. Here, we review Pfizer's leverage over the past years.
| Metric | 2024 | 2023 | 2022 |
|---|---|---|---|
| Debt-to-Equity | 75.95 % | 79.59 % | 36.44 % |
| Debt-to-Assets | 31.39 % | 31.28 % | 17.68 % |
| Debt-to-Capital | 43.17 % | 44.32 % | 26.71 % |
| Net Debt to EBITDA | 3.64 | 7.11 | 0.84 |
| Current Ratio | 1.17 | 0.91 | 1.22 |
| Quick Ratio | 0.92 | 0.69 | 1.00 |
| Financial Leverage | 2.42 | 2.54 | 2.06 |
Pfizer maintains a solid financial structure; however, increasing debt ratios may signal rising leverage. Still, coverage ratios show the company can service its obligations.
Fundamental Strength & Profitability
🔍 Evaluating profitability is crucial for understanding long-term viability. Pfizer's profit metrics indicate its efficiency in converting revenue to profits.
| Metric | 2024 | 2023 | 2022 |
|---|---|---|---|
| Return on Equity | 9.09 % | 2.40 % | 32.79 % |
| Return on Assets | 3.76 % | 0.94 % | 15.90 % |
| Margins: Net | 12.60 % | 3.58 % | 31.26 % |
| EBIT | 17.47 % | 5.49 % | 35.85 % |
| EBITDA | 28.49 % | 16.05 % | 40.90 % |
| Gross | 65.77 % | 50.95 % | 61.89 % |
| Research & Development to Revenue | 16.88 % | 17.76 % | 11.39 % |
Pfizer's return metrics reveal robust profitability, especially in 2022, though recent years show some decline, reflecting lower profit retention during investment cycles.
Price Development
📊 Dividend Scoring System
The Dividend Scoring System evaluates Pfizer's ability to maintain and grow its dividends across different metrics:
| Criteria | Score (1-5) | Score Bar |
|---|---|---|
| Dividend yield | 4 | |
| Dividend Stability | 5 | |
| Dividend growth | 3 | |
| Payout ratio | 3 | |
| Financial stability | 4 | |
| Dividend continuity | 5 | |
| Cashflow Coverage | 4 | |
| Balance Sheet Quality | 3 |
Total Score: 31/40
Rating
Overall, Pfizer exhibits a strong commitment to its dividends with modest growth over the years. Although its payout ratios are high, the company has managed consistent payments, emphasizing stability. Investors seeking income with a foothold in the pharmaceutical sector will find Pfizer a reliable option, albeit remaining mindful of potential changes in financial metrics that may impact dividend sustainability.
Smart Data Insight
Master the Perfect Entry & Exit for this Stock
Don't leave your profits to chance. Historically, this stock follows specific seasonal patterns that institutional traders use to maximize returns.
- ✅ Identify the "Golden Buying Window"
- ✅ Avoid high-risk correction cycles
- ✅ Backtested data from the last 20+ years