
July 13, 2026 a 04:03 am
PEP: Trend and Support & Resistance Analysis - PepsiCo, Inc.
PepsiCo, Inc. continues to showcase adaptability in a competitive global market, presenting a diversified portfolio. The stock's recent trend analysis highlights strategic areas of interest for investors seeking opportunities within the consumer goods sector. With a vast distribution network and strong brand presence, PepsiCo remains a compelling option for those looking to invest in a steady yet dynamic enterprise.
Trend Analysis
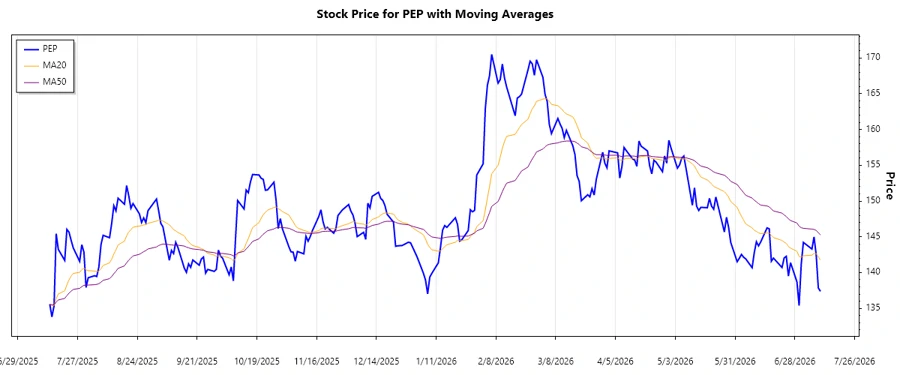
Analyzing the historical price data of PepsiCo, Inc. over the past months, we note that the price action shows significant fluctuations. Utilizing the Exponential Moving Averages (EMA), we calculate the EMA20 and EMA50. Through the analysis of these EMAs, we determine the trend dynamics over the selected period.
| Date | Closing Price | Trend |
|---|---|---|
| 2026-07-10 | $137.38 | ▼ |
| 2026-07-09 | $137.86 | ▼ |
| 2026-07-08 | $142.51 | ▲ |
| 2026-07-07 | $144.98 | ▲ |
| 2026-07-06 | $143.29 | ▲ |
| 2026-07-02 | $144.22 | ▲ |
| 2026-07-01 | $141.16 | ▼ |
The recent EMA analysis reveals a mixed trend scenario, with potential reversals seen in recent days. This trend direction suggests possible market corrections that investors should be aware of.
Support and Resistance
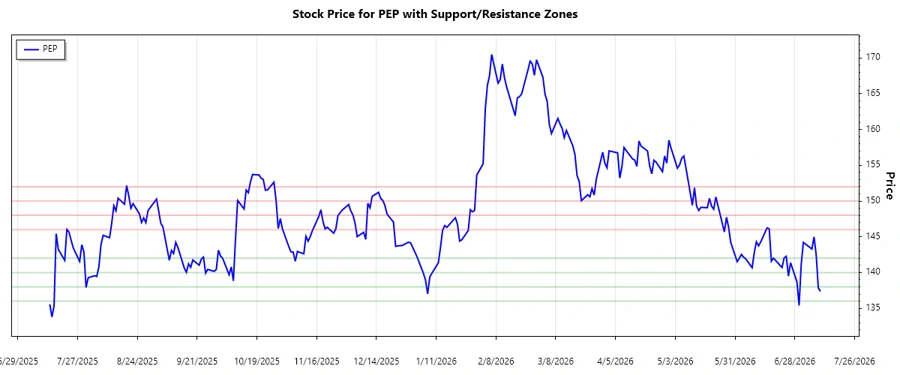
The analysis extends to identifying critical support and resistance levels within the current trading range. These levels serve as potential anchors for price movement, indicating zones where buying or selling pressure may intensify.
| Zone Type | Price Range |
|---|---|
| Resistance 1 | $146.00 - $148.00 |
| Resistance 2 | $150.00 - $152.00 |
| Support 1 | $140.00 - $142.00 |
| Support 2 | $136.00 - $138.00 |
The current price of PepsiCo, Inc. is fluctuating near the established support zones. Investors may consider these levels for potential entries or exits, depending on broader market conditions.
Conclusion
PepsiCo's stock performance underscores a complex scenario of both opportunity and caution. The identified trend suggests that while there are favorable conditions for growth, investors must remain vigilant to emerging risks. The support and resistance zones mimic key potential turning points that can heavily influence market strategy. Overall, the data highlights the need for strategic positioning, enabling both short-term traders and long-term investors to navigate this dynamic environment effectively.
Smart Data Insight
Master the Perfect Entry & Exit for this Stock
Don't leave your profits to chance. Historically, this stock follows specific seasonal patterns that institutional traders use to maximize returns.
- ✅ Identify the "Golden Buying Window"
- ✅ Avoid high-risk correction cycles
- ✅ Backtested data from the last 20+ years