March 04, 2026 a 08:15 am

PEP: Trend and Support & Resistance Analysis - PepsiCo, Inc.
The recent analysis of PepsiCo's stock suggests a predominantly stable market environment with slight inclinations toward an upward trend over the last few months. Given the strong brand presence and diverse product portfolio, PepsiCo continues to hold substantial growth potential. However, market volatility and economic conditions could impact future performance. Technical indicators signal caution while providing opportunities for long-term investors. The presence of critical support levels provides a buffer against potential downturns.
Trend Analysis
| Date | Close Price | Trend |
|---|---|---|
| 2026-03-03 | $164.91 | ▲ |
| 2026-03-02 | $167.28 | ▲ |
| 2026-02-27 | $169.74 | ▲ |
| 2026-02-26 | $167.58 | ▲ |
| 2026-02-25 | $169.17 | ▲ |
| 2026-02-24 | $169.54 | ▲ |
| 2026-02-23 | $168.32 | ▲ |
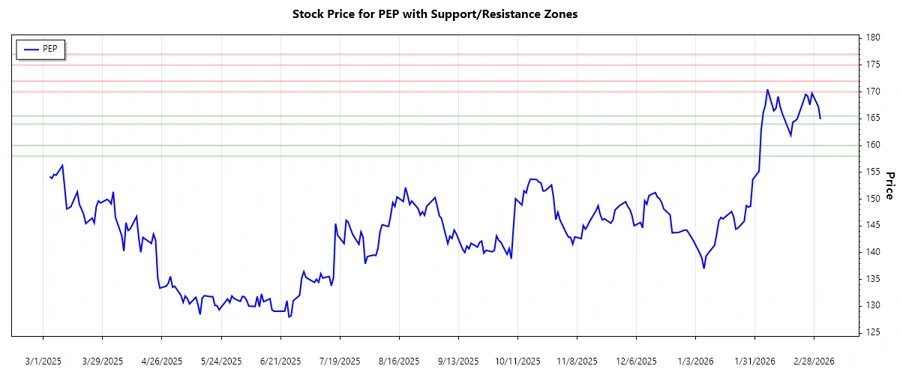
The current trend indicated by the EMA20 crossing above the EMA50 signifies a bullish trend. This suggests momentum in a positive direction, offering potential opportunities for growth. The technical outlook supports potential upward movement in PepsiCo's stock value.
Support and Resistance
| Zone Type | From | To |
|---|---|---|
| Support 1 | $164.00 | $165.50 |
| Support 2 | $158.00 | $160.00 |
| Resistance 1 | $170.00 | $172.00 |
| Resistance 2 | $175.00 | $177.00 |
Currently, PepsiCo's stock is navigating close to the resistance zone, indicating potential for a breakout if bullish momentum persists. If the stock retracts, strong support levels could provide stability. These zones will serve as critical decision-making markers for traders.
Conclusion
In conclusion, PepsiCo's stock is presenting a buoyant technical outlook, reinforced by upward trend indicators and solid underpinning support levels. While challenges exist, including market unpredictability, the resilience and brand strength of PepsiCo could translate into ongoing robust performance. Investors are advised to monitor these support and resistance zones closely for actionable insights. A potential breakout above resistance levels could signal strong buying opportunities ahead.