
July 03, 2026 a 03:43 pm

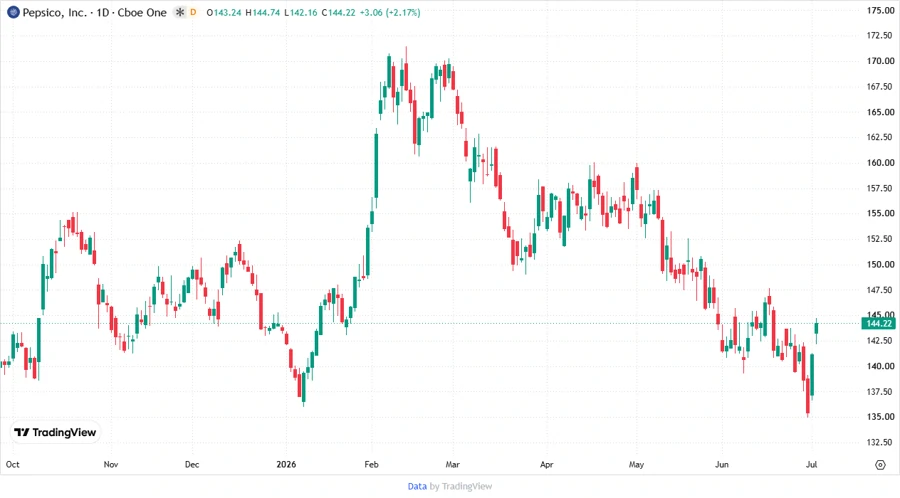
PEP: Fundamental Ratio Analysis - PepsiCo, Inc.
PepsiCo, Inc. offers a resilient investment opportunity, prominently positioned in the consumer defensive sector. With a history of steady growth and diverse product lines, the company is well-equipped to withstand market fluctuations. Investors may find value in PepsiCo's global footprint and innovative product development.
Fundamental Rating
PepsiCo's fundamentals reflect stability with room for improvement. The data below summarizes key financial ratios alongside their corresponding scores.
| Category | Score | Visualization |
|---|---|---|
| Overall | 3 | |
| Discounted Cash Flow | 3 | |
| Return On Equity | 5 | |
| Return On Assets | 4 | |
| Debt To Equity | 1 | |
| Price To Earnings | 2 | |
| Price To Book | 1 |
Historical Rating
The historical ratings provide a snapshot comparison of current and past scores, reflecting subtle shifts in performance.
| Date | Overall | DCF | ROE | ROA | D/E | P/E | P/B |
|---|---|---|---|---|---|---|---|
| 2026-07-02 | 3 | 3 | 5 | 4 | 1 | 2 | 1 |
| [Previous Date] | 0 | 3 | 5 | 4 | 1 | 2 | 1 |
Analyst Price Targets
Analyst estimates suggest a moderate range for potential stock price movement, reflecting market sentiments.
| High | Low | Median | Consensus |
|---|---|---|---|
| $191 | $142 | $165.5 | $167.2 |
Analyst Sentiment
Analyst sentiment is predominantly neutral with a fair number of hold ratings.
| Recommendation | Count | Visualization |
|---|---|---|
| Strong Buy | 1 | |
| Buy | 15 | |
| Hold | 28 | |
| Sell | 1 | |
| Strong Sell | 0 |
Conclusion
PepsiCo, Inc. stands strong in the consumer defensive sector with a diverse product portfolio and expansive market reach. The company's robust distribution network and innovation in product offerings provide resilience against economic uncertainties. Analysts present a neutral consensus, reflecting stable market performance with cautious optimism. Investors focused on long-term stable growth might find this stock appealing, despite noted debt concerns. Future investments should consider market conditions and shifts in consumer preferences.
Smart Data Insight
Master the Perfect Entry & Exit for this Stock
Don't leave your profits to chance. Historically, this stock follows specific seasonal patterns that institutional traders use to maximize returns.
- ✅ Identify the "Golden Buying Window"
- ✅ Avoid high-risk correction cycles
- ✅ Backtested data from the last 20+ years