
July 22, 2026 a 04:44 pm
PEP: Fibonacci Analysis - PepsiCo, Inc.
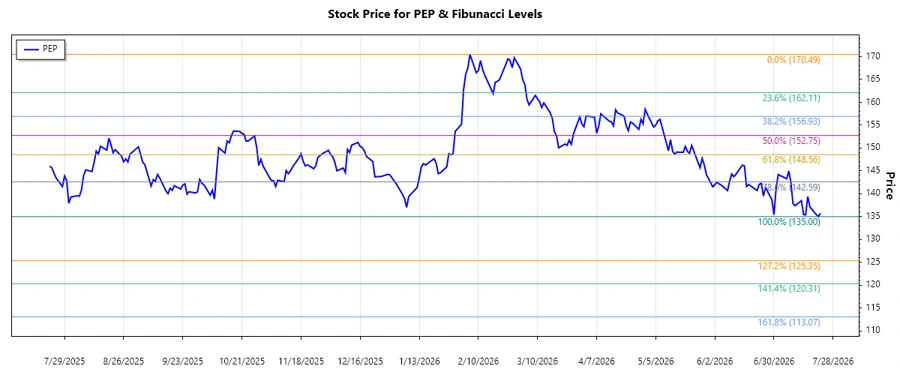
PepsiCo, Inc. is currently experiencing a declining trend in its stock value. Given its diversified product range, PepsiCo still holds a strong market position. However, recent downward movements in the stock price indicate a lack of investor confidence, possibly due to market dynamics or company-specific challenges. The following analysis will delve into the technical aspects using Fibonacci retracement to highlight potential support and resistance levels.
Fibonacci Analysis
| Aspect | Details |
|---|---|
| Trend Type | Down |
| Trend Start Date | 2026-02-06 |
| Trend End Date | 2026-07-22 |
| High Price | $170.49 (2026-02-06) |
| Low Price | $135.00 (2026-07-21) |
| Fibonacci Level | Price Level |
|---|---|
| 0.236 | $144.10 |
| 0.382 | $150.08 |
| 0.5 | $152.75 |
| 0.618 | $155.42 |
| 0.786 | $159.45 |
Currently, the price is hovering around the 0.236 retracement level at approximately $144.10. This could indicate a potential support level, though if the price breaks below, further decline could be anticipated.
This technical setup suggests that PepsiCo is currently at a potential support level. A break below might lead to continued downward momentum, while holding this level could signal a bounce or reversal.
Conclusion
The current downtrend in PepsiCo’s stock presents both risks and opportunities. While the negative trend suggests potential challenges, PepsiCo's diversified product portfolio and global market presence offer a counterbalance against long-term bearish outlooks. In the immediate term, if prices maintain above the key Fibonacci levels, it might indicate stabilization and a possible reversal. However, investors should be wary of a break below these levels which could lead to further declines. Monitoring broader market conditions and company-specific news could provide additional insights for a comprehensive analysis.
Smart Data Insight
Master the Perfect Entry & Exit for this Stock
Don't leave your profits to chance. Historically, this stock follows specific seasonal patterns that institutional traders use to maximize returns.
- ✅ Identify the "Golden Buying Window"
- ✅ Avoid high-risk correction cycles
- ✅ Backtested data from the last 20+ years