February 22, 2026 a 03:15 pm

![Stock Chart depicting recent trends in PepsiCo, Inc.]()
PEP: Fibonacci Analysis - PepsiCo, Inc.
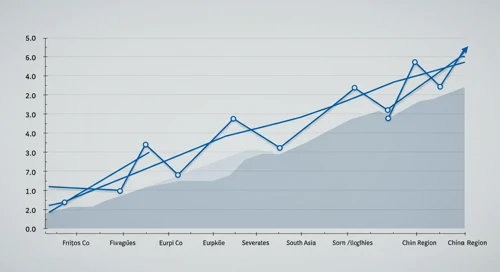
The analysis of PepsiCo, Inc.'s recent stock data shows that the stock is in a significant uptrend over the observed period. Enthusiastic investor sentiment and strong financial performance have driven the stock to recent highs. The market outlook remains positive as PepsiCo continues to deliver solid results, making it an attractive consideration for long-term investors.
Fibonacci Analysis
Based on the data provided, we have observed an uptrend from July 15, 2025, to February 20, 2026. Below are the calculated Fibonacci retracement levels based on the high and low points of this trend:
| Date Type | Date | Price |
|---|---|---|
| Start Date | 2025-07-15 | 133.81 |
| End Date | 2026-02-20 | 164.94 |
| High Point | 2026-02-20 | 164.94 |
| Low Point | 2025-07-15 | 133.81 |
Fibonacci Levels:
| Level | Price |
|---|---|
| 23.6% | 157.09 |
| 38.2% | 152.48 |
| 50.0% | 149.38 |
| 61.8% | 146.27 |
| 78.6% | 141.85 |
Current market price sits at around 164.94, which is above all retracement levels indicating no immediate retracement zone concern. This suggests potential strong support and limited downside risk based on current technical analysis.
Conclusion
PepsiCo's recent upward trend showcases its robust market positioning and investor confidence. While the company is performing well operationally, future challenges may involve navigating economic fluctuations and competitive pressures. However, the stock’s current technical indicators suggest it's well-supported, offering opportunities for growth. Analysts project potential for continued upward momentum, fortified by strategic initiatives and brand strength, enhancing shareholder value. Yet, caution is advised for potential market volatility, which could influence short-term performance.