October 02, 2025 a 11:45 am
PEP: Fibonacci Analysis - PepsiCo, Inc.
PepsiCo, Inc. has shown a dominant downward trend over recent months. This trend reflects potential vulnerabilities in its market performance, posing challenges for short-term investors. However, long-term prospects remain intact, given PepsiCo's robust product portfolio and global market presence. Investors should observe if the recent price levels offer a buying opportunity or anticipate further declines.
Fibonacci Analysis
This analysis focuses on the observed downtrend in PepsiCo, Inc. stock price.
| Parameter | Details |
|---|---|
| Trend Period | 2024-10-08 to 2025-09-30 |
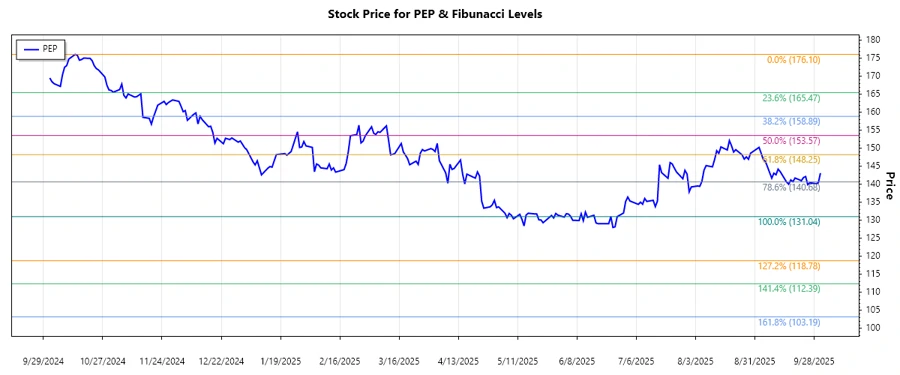
| High Point | $176.10 on 2024-10-14 |
| Low Point | $131.04 on 2025-06-27 |
| Retracement Level | Price Level |
|---|---|
| 0.236 | $140.55 |
| 0.382 | $145.28 |
| 0.5 | $153.57 |
| 0.618 | $161.86 |
| 0.786 | $171.48 |
Currently, the PEP stock is near the 0.236 retracement level, indicating minor recovery potential within a bearish trend. Technically, these levels suggest potential support and resistance zones that investors should watch closely.
Conclusion
The analysis indicates that PepsiCo's stock remains in a downtrend, with recent retracement levels reflecting potential resistance barriers. A breach above these levels could signal reversal potential, enticing investors. However, ongoing external economic pressures and market sentiment might continue to challenge upward movements. For analysts, these dynamic price levels offer insights into risk management strategies and highlight critical points for entering or exiting positions. Long-term market stability and diversification within PepsiCo's operations provide a buffer against continued downward pressure, although caution remains paramount in the near term.
Smart Data Insight
Master the Perfect Entry & Exit for this Stock
Don't leave your profits to chance. Historically, this stock follows specific seasonal patterns that institutional traders use to maximize returns.
- ✅ Identify the "Golden Buying Window"
- ✅ Avoid high-risk correction cycles
- ✅ Backtested data from the last 20+ years