September 14, 2025 a 04:45 pm
PEP: Fibonacci Analysis - PepsiCo, Inc.
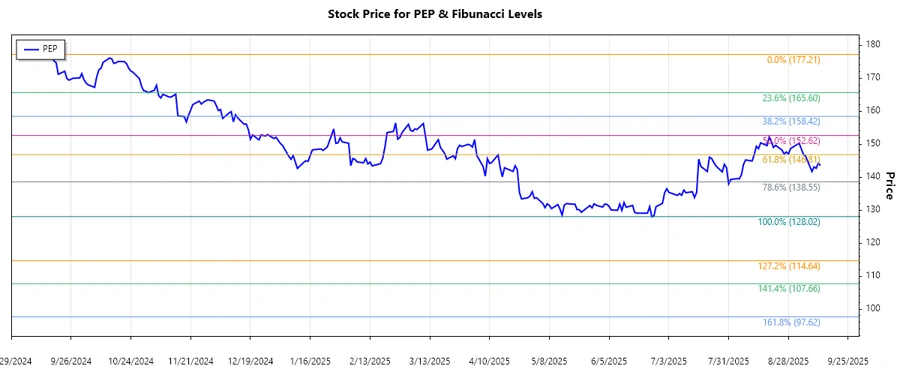
The PepsiCo stock has shown a significant downtrend over the recent months. Investors have been tracking the decline closely, especially given the company's robust business operations and market presence. With recent price movements, technical analysts are focusing on key levels derived from the Fibonacci retracement to identify potential areas of support or resistance.
Fibonacci Analysis
| Detail | Information |
|---|---|
| Trend Start Date | 2024-09-16 |
| Trend End Date | 2025-09-12 |
| High Point | $177.21 on 2024-09-16 |
| Low Point | $128.02 on 2025-06-25 |
| Current Price | $143.53 |
Fibonacci Retracement Levels
| Level | Price |
|---|---|
| 0.236 | $138.17 |
| 0.382 | $146.22 |
| 0.5 | $152.62 |
| 0.618 | $159.03 |
| 0.786 | $168.00 |
The current price of $143.53 is near the 0.236 retracement level, indicating a potential entry point for those considering a buy on retracement strategy. This level may act as a support, providing a foundation for a potential upward correction.
Conclusion
PepsiCo, Inc.'s current technical outlook suggests that the stock is attempting to find support near its Fibonacci retracement level of 0.236. This could be a promising area for investors looking for rebound opportunities, though ongoing economic conditions may still pose risks. While PepsiCo's diversified global operations provide a strong business backdrop, a failure to hold this support level could indicate further downside potential. It's vital for traders to monitor both technical indicators and broader market signals to make informed investment decisions. Given the company's historical resilience and market presence, an upward trend may resume if key support levels hold.
Smart Data Insight
Master the Perfect Entry & Exit for this Stock
Don't leave your profits to chance. Historically, this stock follows specific seasonal patterns that institutional traders use to maximize returns.
- ✅ Identify the "Golden Buying Window"
- ✅ Avoid high-risk correction cycles
- ✅ Backtested data from the last 20+ years