August 07, 2025 a 10:15 am
PEP: Fibonacci Analysis - PepsiCo, Inc.
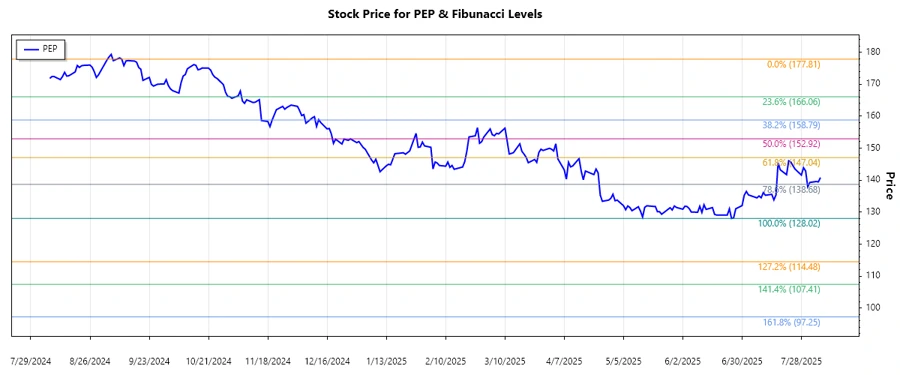
PepsiCo, Inc., a behemoth in the beverages and snack foods industry, showcases a diverse portfolio with operations across various continents. Recently, its stock has been under the spotlight due to a significant price movement. Our technical analysis, focusing on the latest trend, provides insights into potential support and resistance levels that could indicate future price action.
Fibonacci Analysis
| Detail | Value |
|---|---|
| Trend Timeframe | October 15, 2024 - August 6, 2025 |
| Highest Price (Date) | 177.81 (September 10, 2024) |
| Lowest Price (Date) | 128.02 (June 25, 2025) |
| Fibonacci Level | Price Level |
|---|---|
| 0.236 | 138.35 |
| 0.382 | 145.74 |
| 0.5 | 152.92 |
| 0.618 | 160.10 |
| 0.786 | 170.91 |
With a current price of $140.8, PepsiCo's stock is hovering just above the 0.236 Fibonacci level, suggesting this could act as a near-term support zone. If it breaks below, the next significant level to watch would be the 0.382 level.
The Fibonacci retracement offers critical insight, hinting that if the price respects these levels, they could serve as strong support and resistance zones for future price movements.
Conclusion
PepsiCo's stock has demonstrated resilience despite recent fluctuations. The identified Fibonacci levels indicate potential price zones that are crucial for traders. A breach above estimated resistance can lead to bullish momentum, while a fall below support may result in bearish trends. Analysts should closely monitor these technical levels in conjunction with broader market conditions and company-specific news for informed trading decisions. The use of Fibonacci retracement levels can enhance both risk management and profit targeting strategies.
Smart Data Insight
Master the Perfect Entry & Exit for this Stock
Don't leave your profits to chance. Historically, this stock follows specific seasonal patterns that institutional traders use to maximize returns.
- ✅ Identify the "Golden Buying Window"
- ✅ Avoid high-risk correction cycles
- ✅ Backtested data from the last 20+ years