May 17, 2026 a 07:31 am
PEP: Dividend Analysis - PepsiCo, Inc.
PepsiCo, Inc. presents a compelling case for dividend investors, offering a robust yield and a solid track record of consistent payouts. With over five decades of uninterrupted dividend history, PepsiCo positions itself as a mature and reliable investment. However, the analysis reveals some potential areas of concern regarding payout ratios, warranting caution moving forward.
📊 Overview
The analysis of PepsiCo, Inc. showcases it as a staple in the consumer staples sector with a notable dividend yield of 3.85%. This dividend stock has maintained its trajectory of payments for 55 years, signifying a strong historical commitment to rewarding shareholders.
| Sector | Dividend Yield | Current Dividend Per Share | Dividend History | Last Cut or Suspension |
|---|---|---|---|---|
| Consumer Staples | 3.85% | 5.59 USD | 55 years | None |
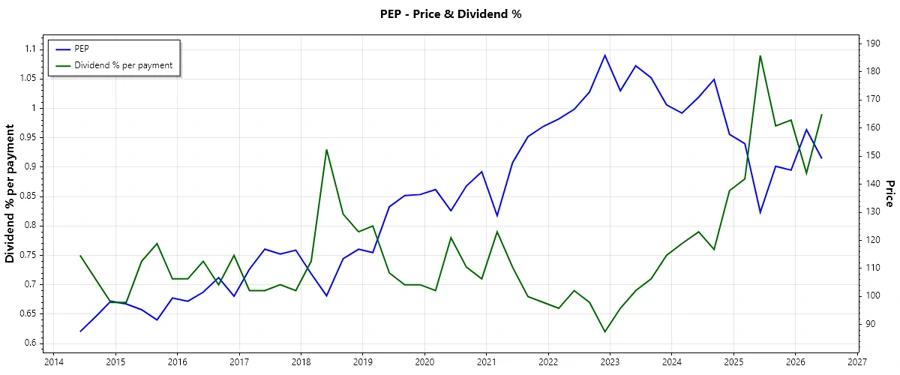
🗣️ Dividend History
With a steadfast history, PepsiCo's dividends have withstood market fluctuations, demonstrating resilience. Reviewing past dividend distributions highlights their significance in both stability and earnings assurance to investors.
| Year | Dividend Per Share (USD) |
|---|---|
| 2026 | 2.9025 |
| 2025 | 5.6225 |
| 2024 | 5.330 |
| 2023 | 4.945 |
| 2022 | 4.525 |
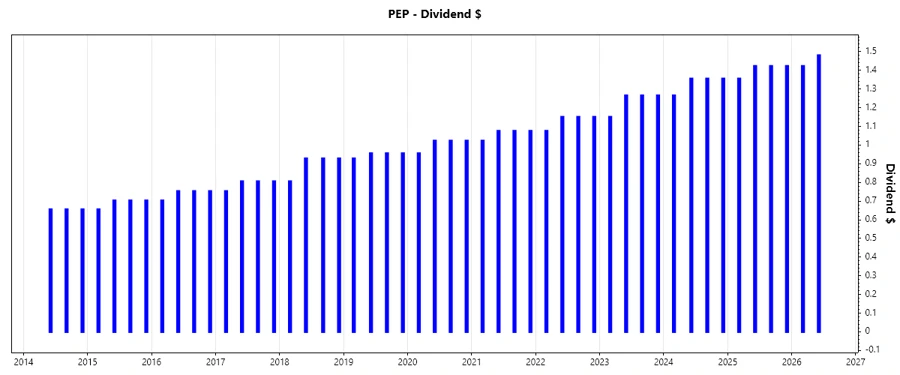
📈 Dividend Growth
The continuing growth of dividends over the years has supported investor confidence, implicating both safety and expansion. Dividend growth rates are crucial in understanding a firm's financial health and foresight.
| Time | Growth |
|---|---|
| 3 years | 7.51% |
| 5 years | 6.93% |
The average dividend growth is 6.93% over 5 years. This shows moderate but steady dividend growth.
⚠️ Payout Ratio
Payout ratios serve as an indicator of how much of the company's earnings and cash flow are returned to shareholders. PepsiCo's current payout ratios may suggest limited room for additional dividend increases without growth in earnings.
| Key figure ratio | Value |
|---|---|
| EPS-based | 87.33% |
| Free cash flow-based | 86.36% |
The EPS-based payout ratio of 87.33% and the FCF-based ratio of 86.36% indicate a high distribution level, suggesting limited flexibility for dividend increases without improved profitability or cash flow.
✅ Cashflow & Capital Efficiency
Cash flow metrics are crucial for assessing the company's ability to sustain dividends. PepsiCo's capital efficiency indicates moderate productivity regarding cash reinvestment and desired financial returns.
| Year | 2025 | 2024 | 2023 |
|---|---|---|---|
| Free Cash Flow Yield | 3.90% | 3.44% | 3.39% |
| Earnings Yield | 4.19% | 4.59% | 3.88% |
| CAPEX to Operating Cash Flow | 32.51% | 42.52% | 41.05% |
| Stock-based Compensation to Revenue | 0.31% | 0.39% | 0.42% |
| Free Cash Flow / Operating Cash Flow Ratio | 63.47% | 57.48% | 58.95% |
The cash flow stability and capital efficiency are adequate, supporting ongoing dividend payments, although improvements could enhance shareholder returns.
Balance Sheet & Leverage Analysis
The examination of the balance sheet and leverage metrics offers insights into the company's financial stability and capital structure. PepsiCo's leverage ratios suggest a well-managed debt profile essential for maintaining financial health and dividend policies.
| Year | 2025 | 2024 | 2023 |
|---|---|---|---|
| Debt-to-Equity | 2.45 | 2.49 | 2.41 |
| Debt-to-Assets | 46.46% | 45.19% | 44.44% |
| Debt-to-Capital | 70.98% | 71.36% | 70.71% |
| Net Debt to EBITDA | 2.80 | 2.18 | 2.22 |
| Current Ratio | 0.85 | 0.82 | 0.85 |
| Quick Ratio | 0.67 | 0.65 | 0.68 |
| Financial Leverage | 5.26 | 5.51 | 5.43 |
With a balanced debt approach and measured use of leverage, PepsiCo appears stable, adequately managing its financial obligations while potentially enhancing equity returns.
Fundamental Strength & Profitability
Fundamentals reveal the core profitability and efficiency of PepsiCo, vital for dividend funding and future growth. High return metrics suggest strong management and efficient capital use.
| Year | 2025 | 2024 | 2023 |
|---|---|---|---|
| Return on Equity | 40.38% | 53.09% | 49.04% |
| Return on Assets | 7.67% | 9.63% | 9.03% |
| Net Profit Margin | 8.77% | 10.43% | 9.92% |
| EBIT Margin | 12.10% | 14.01% | 13.38% |
| EBITDA Margin | 16.55% | 18.16% | 17.23% |
| Gross Margin | 54.15% | 54.55% | 54.21% |
The high profitability indicators of PepsiCo are commendable, articulating its ability to generate robust shareholder returns and sustain financial growth over time.
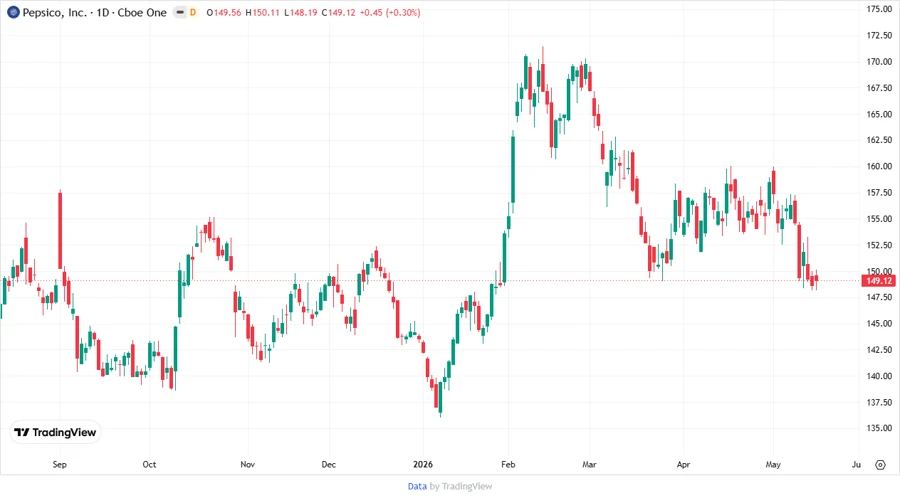
📉 Price Development
🗺️ Dividend Scoring System
This composite scoring evaluates key dividend attributes of PepsiCo, assessing the firm's attractiveness as a dividend investment choice.
| Category | Score | Rating |
|---|---|---|
| Dividend yield | 4 | |
| Dividend Stability | 5 | |
| Dividend growth | 4 | |
| Payout ratio | 3 | |
| Financial stability | 4 | |
| Dividend continuity | 5 | |
| Cashflow Coverage | 3 | |
| Balance Sheet Quality | 4 |
Total Score: 32/40
📝 Rating
PepsiCo, Inc. presents itself as a strong dividend performer with unwavering stability. The company offers an appealing dividend yield with a long history of payments, making it attractive for income-focused investors. Despite the positive outlook, the high payout ratios necessitate monitoring to ensure future growth sustainability. Overall, PepsiCo maintains its standing as a reliable and prudent dividend stock choice with promising financial metrics underpinning its shareholder value proposition.
Smart Data Insight
Master the Perfect Entry & Exit for this Stock
Don't leave your profits to chance. Historically, this stock follows specific seasonal patterns that institutional traders use to maximize returns.
- ✅ Identify the "Golden Buying Window"
- ✅ Avoid high-risk correction cycles
- ✅ Backtested data from the last 20+ years