June 11, 2025 a 07:31 am


PEP: Dividend Analysis - PepsiCo, Inc.
PepsiCo, Inc. stands as a stalwart in the beverage and snack industry. With a robust dividend history, the company's commitment to shareholder returns remains evident. The analysis covers its dividend yield, history, growth, and payout ratios, reflecting its financial health and strategic direction. Investors should watch for growth potential and stability amid changing market dynamics.
📊 Overview
PepsiCo displays a solid dividend yield of 4.22%, enhanced by a committment to shareholder wealth over a substantial 54-year dividend history without recent cuts.
| Metric | Details |
|---|---|
| Sector | Beverage and Snack |
| Dividend yield | 4.22% |
| Current dividend per share | 5.27 USD |
| Dividend history | 54 years |
| Last cut or suspension | None |
🗣️ Dividend History
PepsiCo's dividend history underscores its reliability and sustained investor trust. This consistent payout is crucial for income-focused investors.
| Year | Dividend per share (USD) |
|---|---|
| 2025 | 2.7775 |
| 2024 | 5.330 |
| 2023 | 4.945 |
| 2022 | 4.525 |
| 2021 | 4.2475 |
📈 Dividend Growth
The dividend growth profile of PepsiCo indicates its progressive policy, vital for maintaining investors' purchasing power against inflation.
| Time | Growth |
|---|---|
| 3 years | 7.86% |
| 5 years | 7.04% |
The average dividend growth is 7.04% over 5 years. This shows moderate but steady dividend growth.
Payout Ratio
The payout ratios provide insight into the sustainability of PepsiCo's dividends relative to its earnings and cash flows.
| Key Figure | Ratio |
|---|---|
| EPS-based | 77.09% |
| Free cash flow-based | 99.32% |
PepsiCo's payout ratios hint at cautious optimism. The EPS-based ratio of 77.09% reflects a high yet manageable payout, whereas the FCF-based figure suggests potential constraints from free cash flows.
Cashflow & Capital Efficiency
Analyzing cash flows is pivotal in evaluating the financial maneuvers and operational efficiency of PepsiCo.
| Metric | 2024 | 2023 | 2022 |
|---|---|---|---|
| Free Cash Flow Yield | 3.42% | 3.39% | 2.25% |
| Earnings Yield | 4.56% | 3.88% | 3.57% |
| CAPEX to Operating Cash Flow | 42.20% | 41.05% | 48.16% |
| Stock-based Compensation to Revenue | 0.39% | 0.41% | 0.40% |
| Free Cash Flow / Operating Cash Flow Ratio | 57.48% | 58.95% | 51.84% |
The steady cashflows and robust capital efficiency metrics highlight PepsiCo's strategic capital allocation and commendable cash control.
Balance Sheet & Leverage Analysis
An appreciation of PepsiCo's leverage metrics reveals its handling of long-term financial obligations.
| Metric | 2024 | 2023 | 2022 |
|---|---|---|---|
| Debt-to-Equity | 2.49 | 2.41 | 2.31 |
| Debt-to-Assets | 45.19% | 44.44% | 42.91% |
| Debt-to-Capital | 71.36% | 70.71% | 69.76% |
| Net Debt to EBITDA | 2.18 | 2.22 | 2.31 |
| Current Ratio | 0.82 | 0.85 | 0.80 |
| Quick Ratio | 0.65 | 0.68 | 0.61 |
| Financial Leverage | 5.51 | 5.43 | 5.38 |
The analysis points towards manageable leverage positions, with PepsiCo sustaining a balanced levered strategy consistent with its business model.
Fundamental Strength & Profitability
Fundamental analysis underlines how fluently PepsiCo converts revenue into profit and the efficiency of asset utilization.
| Metric | 2024 | 2023 | 2022 |
|---|---|---|---|
| Return on Equity | 53.09% | 49.04% | 51.96% |
| Return on Assets | 9.62% | 9.03% | 9.67% |
| Margins - Net | 10.43% | 9.92% | 10.31% |
| EBIT Margin | 14.01% | 13.38% | 13.48% |
| EBITDA Margin | 18.16% | 17.22% | 17.27% |
| Gross Margin | 54.55% | 54.21% | 53.03% |
| R&D to Revenue | 0.00% | 0.00% | 0.00% |
The robust profitability and efficiency ratios signal strong managerial efficacy in bolstering PepsiCo's competitive position.
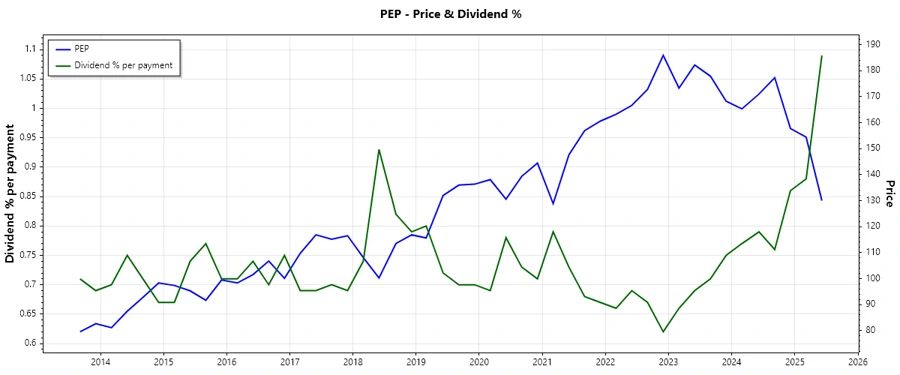
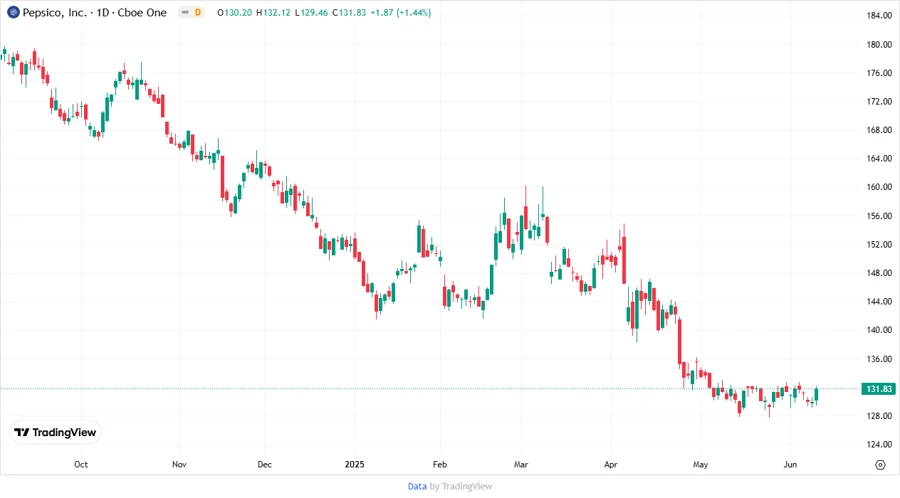
Price Development
Dividend Scoring System
| Category | Score | |
|---|---|---|
| Dividend yield | 4 | |
| Dividend Stability | 5 | |
| Dividend Growth | 3 | |
| Payout Ratio | 3 | |
| Financial Stability | 4 | |
| Dividend Continuity | 5 | |
| Cashflow Coverage | 4 | |
| Balance Sheet Quality | 4 |
Overall Score: 32/40
Rating
PepsiCo earns a solid rating owing to its consistent dividend performance, reliable cash flows, and stable leverage activities. It is recommended for income-seeking investors due to its substantial dividend history and steady growth, although the slightly higher payout ratio warrants cautious monitoring.
Smart Data Insight
Master the Perfect Entry & Exit for this Stock
Don't leave your profits to chance. Historically, this stock follows specific seasonal patterns that institutional traders use to maximize returns.
- ✅ Identify the "Golden Buying Window"
- ✅ Avoid high-risk correction cycles
- ✅ Backtested data from the last 20+ years