February 05, 2026 a 01:15 pm
PEG: Trend and Support & Resistance Analysis - Public Service Enterprise Group Incorporated
The Public Service Enterprise Group Incorporated (PEG) operates in the energy sector with a focus on sustainable and efficient solutions. The recent trend analysis suggests moderate fluctuations in prices with potential opportunities for growth. Support and resistance zones indicate key levels to watch for possible breakouts or reversals in the near future. Investors should monitor these zones closely to gauge market sentiment and strategic entry or exit points.
Trend Analysis
| Date | Closing Price | Trend |
|---|---|---|
| 2026-02-04 | 80.14 | 🔽 |
| 2026-02-03 | 81.56 | 🔼 |
| 2026-02-02 | 80.31 | 🔽 |
| 2026-01-30 | 82.36 | 🔼 |
| 2026-01-29 | 82.00 | 🔼 |
| 2026-01-28 | 81.45 | ⚖️ |
| 2026-01-27 | 80.42 | 🔽 |
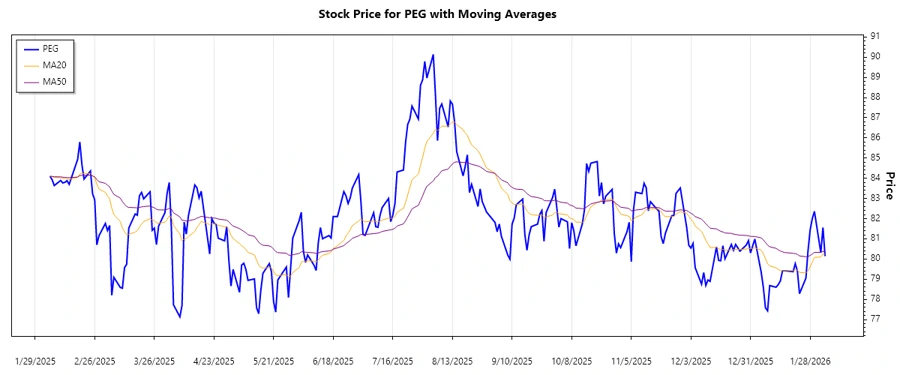
Over the analyzed period, the stock exhibited a mixed trend with varying upward and downward movements. The EMA20 has crossed below the EMA50, indicating a prevailing downward trend in the immediate short-term.
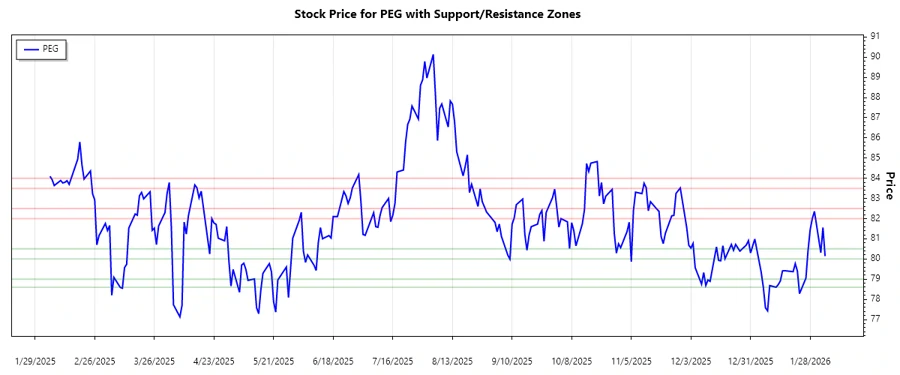
Support and Resistance
| Zone | From | To |
|---|---|---|
| Support 1 | 78.60 | 79.00 |
| Support 2 | 80.00 | 80.50 |
| Resistance 1 | 82.00 | 82.50 |
| Resistance 2 | 83.50 | 84.00 |
Currently, the stock price is within the first resistance zone, suggesting potential selling pressure or a chance for a breakout if sustained buying occurs. Investors should remain vigilant if prices test these levels.
Conclusion
The Public Service Enterprise Group Incorporated (PEG) stock shows signs of a short-term downtrend, as indicated by the EMA analysis. The key support and resistance zones identified should be closely monitored for potential trading opportunities. The market sentiment seems cautious with a mix of support and resistance levels being tested. While promising, the stock is sensitive to broader market conditions and any fundamental shifts in the energy sector. Investors should weigh potential risks and benefits carefully before making investment decisions.