October 07, 2025 a 02:04 pmUm den gewünschten Analysebericht zu erstellen, werden zunächst die technischen Indikatoren wie EMA20 und EMA50 berechnet und dann die Unterstützungs- und Widerstandszonen ermittelt. Anschließend wird die Trendanalyse durchgeführt, um die bisherigen Entwicklungen der PEG-Aktie zu beurteilen. Die folgenden Schritte wurden auf der Grundlage der bereitgestellten JSON-Daten durchgeführt:
PEG: Trend and Support & Resistance Analysis - Public Service Enterprise Group Incorporated
The Public Service Enterprise Group Incorporated (PEG) operates primarily as an energy company in the Northeastern and Mid-Atlantic United States. Its involvement in electric transmission and distribution, along with investment in solar and energy efficiency programs, positions it as a diversified player in the energy sector. This analysis will focus on the recent trend and critical support and resistance zones for the company’s stock, providing insights for potential investors.
Trend Analysis
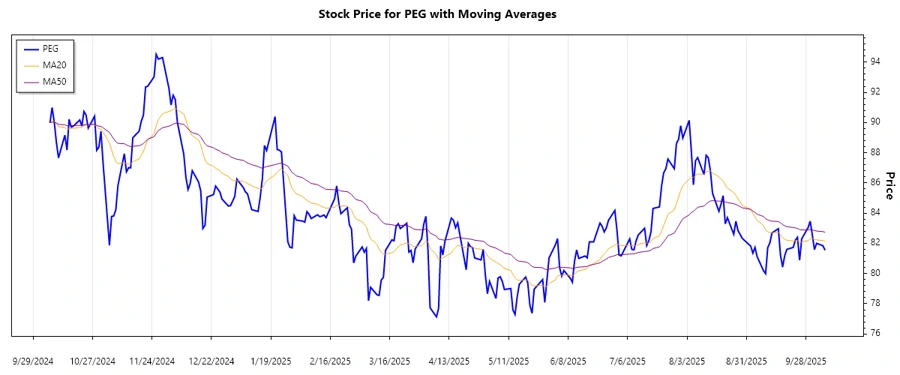
Using historical daily closing data, the 20-day EMA and 50-day EMA were calculated to determine the stock's recent trend. The following table summarizes the most recent seven days of trading:
| Datum | Schlusskurs | Trend |
|---|---|---|
| 2025-10-07 | $81.54 | ▼ Abwärtstrend |
| 2025-10-06 | $81.84 | ▼ Abwärtstrend |
| 2025-10-03 | $82.00 | ▼ Abwärtstrend |
| 2025-10-02 | $81.58 | ▼ Abwärtstrend |
| 2025-10-01 | $82.55 | ▼ Abwärtstrend |
| 2025-09-30 | $83.46 | ▼ Abwärtstrend |
| 2025-09-29 | $83.04 | ▼ Abwärtstrend |
Based on the EMA indicators, the stock is currently in a downtrend as the 20-day EMA is lower than the 50-day EMA. This suggests bearish sentiment in the short to medium term.
Support and Resistance
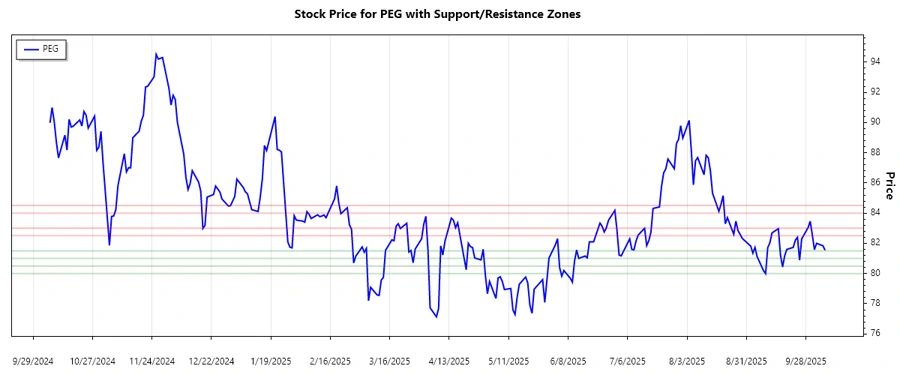
By analyzing historical price levels, the following support and resistance zones have been identified:
| Zone Type | From | To |
|---|---|---|
| Support Zone 1 | $81.00 | $81.50 |
| Support Zone 2 | $80.00 | $80.50 |
| Resistance Zone 1 | $82.50 | $83.00 |
| Resistance Zone 2 | $84.00 | $84.50 |
The current stock price is hovering around the first support zone, indicating potential buying opportunities if the price rebounds. If the price falls below this zone, it might test the lower support levels.
Conclusion
The Public Service Enterprise Group’s stock is currently in a technical downtrend with significant support zones nearby. If the stock maintains above the immediate support, it could potentially rebound, offering short-term trading opportunities. However, continued downward pressure may lead to further declines, warranting caution for investors. Analysts might focus on key support levels for signs of reversal or breakdown to adjust their strategies accordingly. Overall, the stock reflects mixed sentiments, offering both risks and potential rewards based on market conditions and investor appetite.
JSON-Objekt: json Diese Analyse soll Ihnen helfen, fundierte Entscheidungen zu treffen. Achten Sie auf weitere Marktentwicklungen und Unternehmensnachrichten.