May 07, 2026 a 10:15 am
PEG: Fibonacci Analysis - Public Service Enterprise Group Incorporated
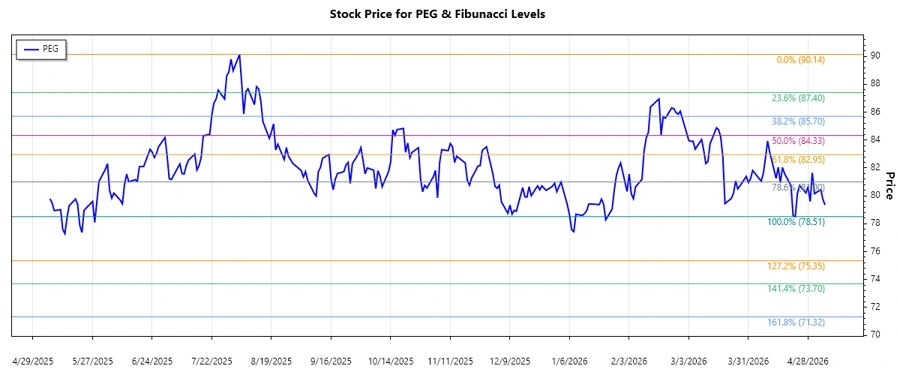
The Public Service Enterprise Group Incorporated (PEG) has shown diverse price movements over the past months. Currently, the stock is navigating through a downward trend. A detailed technical analysis indicates potential support and resistance levels that could impact future price movements. Investors should consider the broader market conditions and energy sector performance while evaluating PEG's potential.
Fibonacci Analysis
| Details | Value |
|---|---|
| Start Date | 2025-08-04 |
| End Date | 2026-05-06 |
| High Price (Date) | $90.14 (2025-08-04) |
| Low Price (Date) | $78.51 (2026-04-22) |
| Fibonacci Level | Price |
|---|---|
| 0.236 | $81.99 |
| 0.382 | $84.56 |
| 0.5 | $86.83 |
| 0.618 | $89.10 |
| 0.786 | $91.82 |
The current price of $79.35 indicates that it is below the Fibonacci retracement levels. Hence, the stock is not within any of the key retracement zones, potentially setting new support levels near its current trading price to watch for any reversal patterns.
The technical interpretation suggests that the PEG stock could face resistance around the nearest Fibonacci levels if a reversal does occur. Investors should consider potential support around the current low prices if the bearish trend continues.
Conclusion
The Public Service Enterprise Group Incorporated (PEG) stock is currently in a downward trend, which highlights a need for cautious investment. Key Fibonacci levels could provide important technical insights regarding possible resistance zones. However, given the momentum, a continued bearish outlook could be anticipated unless a major market or sector catalyst materializes. Market participants should closely monitor PEG's performance relative to the general market and energy sector trends. A strategic approach employing technical levels and fundamental evaluations might help in making informed decisions.
Smart Data Insight
Master the Perfect Entry & Exit for this Stock
Don't leave your profits to chance. Historically, this stock follows specific seasonal patterns that institutional traders use to maximize returns.
- ✅ Identify the "Golden Buying Window"
- ✅ Avoid high-risk correction cycles
- ✅ Backtested data from the last 20+ years