June 30, 2026 a 12:46 pm


📊 Dividend Analysis - Public Service Enterprise Group Incorporated
Public Service Enterprise Group Incorporated exhibits a solid dividend history with stable financial fundamentals. The company offers an attractive dividend yield, while its payout ratios suggest a balanced approach to sharing profits with shareholders. Despite challenges in free cash flow, the long-term potential for sustainable dividends remains strong. Future growth prospects appear moderate, supported by steady dividend increments.
Overview
Public Service Enterprise Group Incorporated operates in the utilities sector, which typically provides investors with steady and reliable dividend returns. The company has maintained a persistent dividend history for 47 years, a testament to its robust financial resilience. The current dividend yield stands at 3.31%, providing a solid return contrasted against market volatility. However, the negative indication in free cash flow coverage could raise concerns for short-term investors.
| Metric | Value |
|---|---|
| Sector | Utilities |
| Dividend yield | 3.31% |
| Current dividend per share | $2.52 |
| Dividend history | 47 years |
| Last cut or suspension | None |
Dividend History
🗣️ Understanding the pattern and reliability of dividend payments is crucial for investors focusing on income stability. Public Service Enterprise Group Incorporated has consistently delivered dividends with gradual increases, ensuring trust and loyalty among its stakeholders. The absence of any cut or suspension over the decades endorses its commitment to shareholder remuneration.
| Year | Dividend Per Share (USD) |
|---|---|
| 2026 | 1.34 |
| 2025 | 2.52 |
| 2024 | 2.40 |
| 2023 | 2.28 |
| 2022 | 2.16 |
Dividend Growth
📈 Analyzing the dividend growth over the years provides insights into the company's future capability to increase returns to shareholders. With an average growth of 5.15% over the last five years, Public Service Enterprise Group Incorporated demonstrates moderate but steady potential for dividend expansion.
| Time | Growth |
|---|---|
| 3 years | 5.27% |
| 5 years | 5.15% |
The average dividend growth is 5.15% over 5 years. This shows moderate but steady dividend growth.
Payout Ratio
📉 The payout ratio is a significant indicator of the sustainability of dividends. A payout ratio based on EPS at 55.59% indicates a conservative yet shareholder-friendly distribution policy. Contrastingly, the free cash flow payout ratio of -1962.95% suggests operational challenges affecting liquidity. Investors must weigh the potential for future cash flow enhancements.
| Key figure | Ratio |
|---|---|
| EPS-based payout ratio | 55.59% |
| Free cash flow-based payout ratio | -1962.95% |
Cashflow & Capital Efficiency
✅ Cash flow indicators are paramount in evaluating a firm's ability to meet its financial obligations. The free cash flow yield highlights operational difficulties, whereas the earnings yield remains stable. A concerning trend is observed with capital expenditure closely surpassing operating cash flow, indicating aggressive reinvestment strategies potentially affecting liquidity.
| Year | 2025 | 2024 | 2023 |
|---|---|---|---|
| Free Cash Flow Yield | 0.81% | -2.96% | 1.58% |
| Earnings Yield | 5.27% | 4.21% | 8.42% |
| CAPEX to Operating Cash Flow | 86.3% | 158.5% | 87.4% |
| Stock-based Compensation to Revenue | 0% | 0% | 0% |
| Free Cash Flow / Operating Cash Flow Ratio | 13.72% | -58.46% | 12.64% |
Balance Sheet & Leverage Analysis
⚠️ Analyzing leverage and balance sheet ratios offers insight into financial health and risk exposure. Public Service Enterprise Group's debt ratios indicate a moderately leveraged position which necessitates caution amidst rising interest obligations. The current and quick ratios demonstrate adequate liquidity to cover short-term liabilities but require ongoing scrutiny during fiscal challenges.
| Year | 2025 | 2024 | 2023 |
|---|---|---|---|
| Debt-to-Equity | 1.44 | 1.42 | 1.32 |
| Debt-to-Assets | 42.33% | 41.89% | 40.22% |
| Debt-to-Capital | 58.94% | 58.68% | 56.87% |
| Net Debt to EBITDA | 5.23 | 5.64 | 4.00 |
| Current Ratio | 1.18 | 0.65 | 0.67 |
| Quick Ratio | 0.60 | 0.48 | 0.46 |
| Financial Leverage | 3.39 | 3.39 | 3.28 |
Fundamental Strength & Profitability
📈 High profitability ratios, especially return on equity and margins, reflect Public Service Enterprise Group's efficient operational management. Margin analysis indicates robust gross and net profitability, with no notable reliance on R&D or stock-based compensation, characterizing a company focusing on core business strategies for sustained growth.
| Year | 2025 | 2024 | 2023 |
|---|---|---|---|
| Return on Equity | 12.43% | 10.99% | 16.56% |
| Return on Assets | 3.67% | 3.24% | 5.05% |
| Net Margin | 17.35% | 17.22% | 22.81% |
| EBIT Margin | 27.77% | 25.91% | 33.54% |
| EBITDA Margin | 38.10% | 39.25% | 45.32% |
| Gross Margin | 69.00% | 34.41% | 42.96% |
| R&D to Revenue | 0% | 0% | 0% |
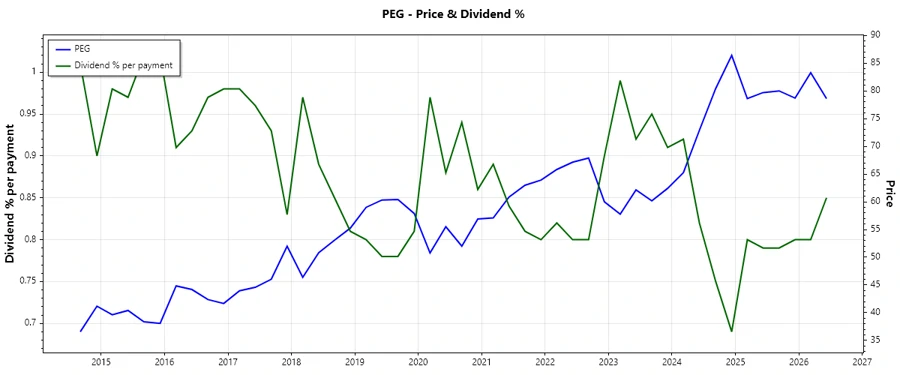
Price Development
Dividend Scoring System
| Category | Score (1-5) | |
|---|---|---|
| Dividend yield | 4 | |
| Dividend Stability | 5 | |
| Dividend growth | 3 | |
| Payout ratio | 2 | |
| Financial stability | 3 | |
| Dividend continuity | 5 | |
| Cashflow Coverage | 2 | |
| Balance Sheet Quality | 3 |
Total Score: 27/40
Rating
Overall, Public Service Enterprise Group Incorporated presents a robust dividend profile with strong historical stability and a consistent yield. While there are concerns regarding cash flow coverage and leverage ratios, the company's steadfast commitment to dividend payments merits a recommendation for income-focused investors. The sustained dividend growth, albeit moderate, suggests potential for future increments, making it a reliable choice for conservative investment portfolios.
Smart Data Insight
Master the Perfect Entry & Exit for this Stock
Don't leave your profits to chance. Historically, this stock follows specific seasonal patterns that institutional traders use to maximize returns.
- ✅ Identify the "Golden Buying Window"
- ✅ Avoid high-risk correction cycles
- ✅ Backtested data from the last 20+ years