
June 18, 2026 a 07:31 am
PEG: Dividend Analysis - Public Service Enterprise Group Incorporated
Public Service Enterprise Group Incorporated (PEG) offers a reliable dividend yield, coupled with a robust history of 47 years of uncut dividends. The firm's consistent payout indicates its stability and commitment to returning value to shareholders. However, the Free Cash Flow payout concerns highlight the need for investors to monitor future cash flow activities.
📊 Overview
Public Service Enterprise Group Incorporated (PEG) operates within the Utility sector, known for stable and regular cash flows. With a dividend yield of 3.31%, it stands as a competitive option for income-focused investors. The company has maintained a commendable record of 47 years without dividend cuts or suspensions.
| Metric | Value |
|---|---|
| Sector: | Utility |
| Dividend yield: | 3.31% |
| Current dividend per share: | 2.52 USD |
| Dividend history: | 47 years |
| Last cut or suspension: | None |
🗣️ Dividend History
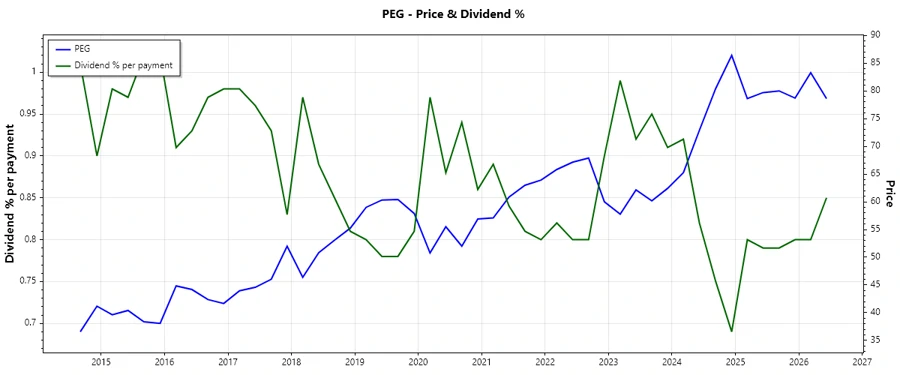
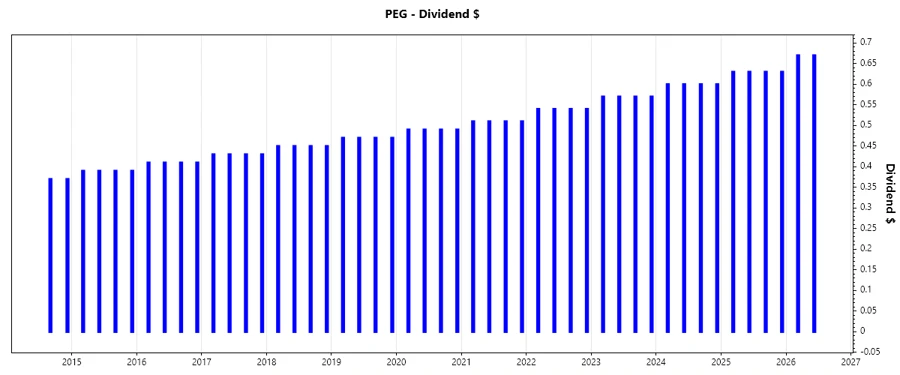
The dividend history of PEG demonstrates strength and consistency, which are critical for long-term income stability. The company's ability to pay and possibly increase dividends over time is a positive indicator for potential investors.
| Year | Dividend per Share (USD) |
|---|---|
| 2026 | 1.34 |
| 2025 | 2.52 |
| 2024 | 2.40 |
| 2023 | 2.28 |
| 2022 | 2.16 |
📈 Dividend Growth
Dividend growth is an essential factor of interest for investors focused on growth and increasing income. PEG's dividend growth over the past few years suggests the firm's continued financial health and commitment to leveraging its cash flows for shareholders.
| Time | Growth |
|---|---|
| 3 years | 5.27% |
| 5 years | 5.15% |
The average dividend growth is 5.15% over 5 years. This shows moderate but steady dividend growth.
✅ Payout Ratio
Payout ratios are crucial for assessing dividend sustainability. PEG demonstrates a payout ratio (EPS-based) of 55.59%, indicating a sustainable dividend system. However, a negative Free Cash Flow-based ratio reflects heightened leverage on its cash flows.
| Key figure | Ratio |
|---|---|
| EPS-based | 55.59% |
| Free cash flow-based | -1962.95% |
⚠️ Cashflow & Capital Efficiency
Effective management of cash flow and capital investments is vital in maintaining operational efficiency and generating value. This section evaluates how PEG is maximizing its capital deployment to sustain growth.
| Metric | 2023 | 2024 | 2025 |
|---|---|---|---|
| Free Cash Flow Yield | 0.016 | -0.030 | 0.008 |
| Earnings Yield | 0.084 | 0.042 | 0.053 |
| CAPEX to Operating Cash Flow | 0.874 | 1.585 | 0.863 |
| Stock-based Compensation to Revenue | 0 | 0 | 0 |
| Free Cash Flow / Operating Cash Flow Ratio | 0.126 | -0.585 | 0.137 |
Overall, the ratios indicate challenges in free cash flow generation, notwithstanding positive earnings yields. Investors should be cautious of capital heavy operations that may pressure future dividend payout and growth.
📉 Balance Sheet & Leverage Analysis
A solid balance sheet and effective leverage management ensure a firm’s long-term financial stability. Analyzing PEG's leverage and liquidity ratios can provide insight into its risk profile and ability to withstand economic pressures.
| Metric | 2023 | 2024 | 2025 |
|---|---|---|---|
| Debt-to-Equity | 1.318 | 1.420 | 1.435 |
| Debt-to-Assets | 0.402 | 0.419 | 0.423 |
| Debt-to-Capital | 0.569 | 0.587 | 0.589 |
| Net Debt to EBITDA | 4.00 | 5.64 | 5.23 |
| Current Ratio | 0.667 | 0.651 | 0.801 |
| Quick Ratio | 0.465 | 0.478 | 0.599 |
| Financial Leverage | 3.278 | 3.391 | 3.390 |
The leverage ratios signal high indebtedness, but manageable liquidity through improvements in the current ratio in 2025, showcasing a potential stabilizing trend for the company's balance sheet.
✅ Fundamental Strength & Profitability
Evaluating a company's profitability highlights its ability to generate returns on assets and equity – critical indicators of financial health. PEG's returns coupled with margins provide a reflection of operational effectiveness.
| Index | 2023 | 2024 | 2025 |
|---|---|---|---|
| Return on Equity | 16.56% | 11.00% | 12.43% |
| Return on Assets | 5.05% | 3.24% | 3.67% |
| Margins: Net | 22.81% | 17.22% | 17.35% |
| Margins: Gross | 42.96% | 34.41% | 69.00% |
| Margins: EBIT | 33.54% | 25.91% | 27.77% |
| Research & Development to Revenue | 0% | 0% | 0% |
PEG’s consistent returns on equity and assets demonstrate strong internal management. However, stagnant R&D expenditure implies potential innovation lags. Nevertheless, robust margins are a testament to its operational control.
⚠️ Price Development
🗣️ Dividend Scoring System
| Criteria | Score | |
|---|---|---|
| Dividend yield | 4 | |
| Dividend Stability | 5 | |
| Dividend growth | 4 | |
| Payout ratio | 3 | |
| Financial stability | 3 | |
| Dividend continuity | 5 | |
| Cashflow Coverage | 2 | |
| Balance Sheet Quality | 3 |
Total Score: 29/40
📈 Rating
Public Service Enterprise Group Incorporated shows robust dividend characteristics, making it an attractive choice for income investors. However, caution is advised on aspects like the Free Cash Flow situation and its leverage, which may impact future financial flexibility. Given the overall performance, PEG earns a solid position in the dividend investment realm.
Smart Data Insight
Master the Perfect Entry & Exit for this Stock
Don't leave your profits to chance. Historically, this stock follows specific seasonal patterns that institutional traders use to maximize returns.
- ✅ Identify the "Golden Buying Window"
- ✅ Avoid high-risk correction cycles
- ✅ Backtested data from the last 20+ years