June 02, 2026 a 03:31 pm

📊 Dividend Analysis - Public Service Enterprise Group Incorporated
Public Service Enterprise Group Incorporated (PEG) showcases a robust dividend profile, marked by its 47-year history of unwavering dividend payments. The consistent dividends provide a sense of reliability for investors seeking stable income. This analysis delves into key metrics, offering a comprehensive insight into PEG's dividend sustainability, growth, and financial health.
Overview
PEG operates within a sector that exhibits resilience and steady yield metrics, appealing primarily to income-focused investors. The current dividend yield and long-standing history reinforce its position as a stable dividend payer.
| Sector | Dividend Yield | Current Dividend per Share | Dividend History | Last Cut or Suspension |
|---|---|---|---|---|
| Utilities | 3.35% | 2.52 USD | 47 years | None |
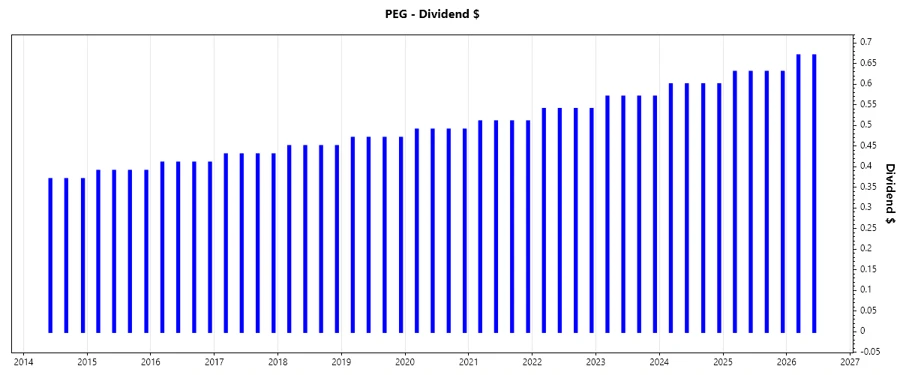
Dividend History
The extensive dividend history of PEG underscores its commitment to shareholders. With dividends paid for 47 uninterrupted years, PEG is synonymous with consistency in the dividend domain. This stability is a testament to the company's enduring profitability and cash flow generation.
| Year | Dividend per Share (USD) |
|---|---|
| 2026 | 1.34 |
| 2025 | 2.52 |
| 2024 | 2.40 |
| 2023 | 2.28 |
| 2022 | 2.16 |
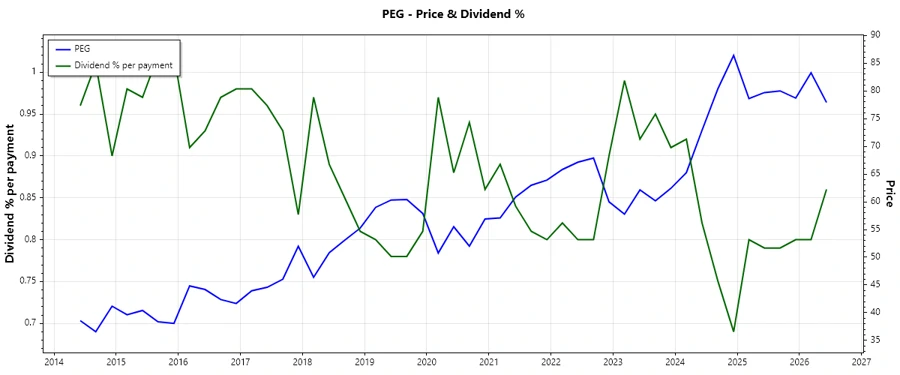
Dividend Growth
Dividend growth metrics are pivotal as they reflect a company's capacity to enhance shareholder value through increasing payouts. PEG's steady growth over the past few years is indicative of solid earnings and cash flow strength.
| Time | Growth |
|---|---|
| 3 years | 5.27% |
| 5 years | 5.15% |
The average dividend growth is 5.15% over 5 years. This shows moderate but steady dividend growth.
Payout Ratio
The payout ratio offers insights into how comfortably a company can sustain its dividend payments. PEG's EPS-based payout suggests relative safety in maintaining current dividend levels despite a negative free cash flow payout ratio.
| Key Figure | Ratio |
|---|---|
| EPS-based | 55.59% |
| Free cash flow-based | -1962.95% |
The EPS-based payout of 55.59% indicates manageable dividend commitments, although the negative FCF payout ratio warrants attention.
Cashflow & Capital Efficiency
Understanding PEG's cash flow and capital efficiency is crucial for assessing long-term financial health. Solid earnings yield and CAPEX efficiency are positive indicators, while the negative free cash flow yield raises potential concerns.
| Year | 2025 | 2024 | 2023 |
|---|---|---|---|
| Free Cash Flow Yield | 0.81% | -2.96% | 1.58% |
| Earnings Yield | 5.27% | 4.21% | 8.42% |
| CAPEX to Operating Cash Flow | 86.27% | 158.46% | 87.36% |
| Stock-based Compensation to Revenue | 0% | 0% | 0% |
| Free Cash Flow / Operating Cash Flow Ratio | 13.72% | -58.46% | 12.64% |
Overall, PEG demonstrates sound earnings efficiency, though its cash flow stability remains an area for improvement due to dips noted in the past years.
Balance Sheet & Leverage Analysis
A comprehensive analysis of PEG's balance sheet highlights its leverage status. Both the debt-to-equity and other leverage metrics are critical for understanding future obligations and liquidity coverage.
| Year | 2025 | 2024 | 2023 |
|---|---|---|---|
| Debt-to-Equity | 143.52% | 142.04% | 131.85% |
| Debt-to-Assets | 42.33% | 41.89% | 40.22% |
| Debt-to-Capital | 58.93% | 58.68% | 56.87% |
| Net Debt to EBITDA | 5.23 | 5.64 | 3.99 |
| Current Ratio | 80.07% | 65.10% | 66.70% |
| Quick Ratio | 59.95% | 47.82% | 46.47% |
| Financial Leverage | 339.04% | 339.08% | 327.85% |
PEG's leverage ratios illustrate a relatively high debt profile, which may impact its ability to raise capital or cover future debt service without impacting its liquidity position.
Fundamental Strength & Profitability
Analyzing fundamentals and profitability allows investors to gauge PEG's operational efficiency. Metrics like return on equity and margins provide insights into profit generation from shareholders' investments.
| Year | 2025 | 2024 | 2023 |
|---|---|---|---|
| Return on Equity | 12.43% | 10.99% | 16.56% |
| Return on Assets | 3.67% | 3.24% | 5.05% |
| Margins: Net | 17.35% | 17.22% | 22.81% |
| EBIT | 27.77% | 25.91% | 33.54% |
| EBITDA | 38.10% | 39.25% | 45.32% |
| Gross | 69.00% | 34.41% | 42.96% |
| R&D to Revenue | 0% | 0% | 0% |
PEG's fundamental strengths, demonstrated by robust profit margins and returns on equity, affirm its standing as a potent entity in its sector, though growth in innovation expenditures remains limited.
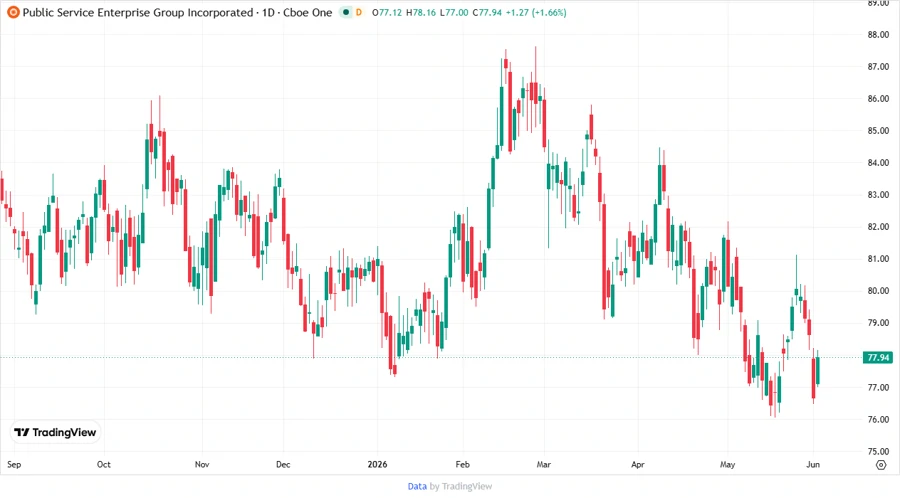
Price Development
Dividend Scoring System
| Criteria | Score | Score Bar |
|---|---|---|
| Dividend Yield | 4 | |
| Dividend Stability | 5 | |
| Dividend Growth | 3 | |
| Payout Ratio | 3 | |
| Financial Stability | 3 | |
| Dividend Continuity | 5 | |
| Cashflow Coverage | 2 | |
| Balance Sheet Quality | 3 |
Total Score: 28/40
Rating
✅ Public Service Enterprise Group Incorporated exhibits commendable dividend payment consistency and profitability measures, making it a strong candidate for income-focused portfolios. However, the highlighted leverage and cash flow challenges necessitate prudent monitoring. Overall, PEG is recommended as a reliable, though potentially volatile, dividend investment.
Smart Data Insight
Master the Perfect Entry & Exit for this Stock
Don't leave your profits to chance. Historically, this stock follows specific seasonal patterns that institutional traders use to maximize returns.
- ✅ Identify the "Golden Buying Window"
- ✅ Avoid high-risk correction cycles
- ✅ Backtested data from the last 20+ years