February 09, 2026 a 11:31 am

PEG: Dividend Analysis - Public Service Enterprise Group Incorporated
Public Service Enterprise Group Incorporated (PEG) exhibits a robust dividend profile backed by 46 years of dividend history and a respectable dividend yield of 3.20%. The company's resilience is highlighted by its consistent payments and steady dividend growth, positioning it as a reliable option for income-focused investors. However, the elevated payout ratios, particularly on a free cash flow basis, merit careful consideration.
📊 Overview
The company operates within the utility sector, a domain known for its stable cash flows, which significantly contributes to its sustained dividend payouts. The following table provides a snapshot of PEG's dividend characteristics:
| Aspect | Details |
|---|---|
| Sector | Utilities |
| Dividend yield | 3.20% |
| Current dividend per share | 2.40 USD |
| Dividend history | 46 years |
| Last cut or suspension | 1990 |
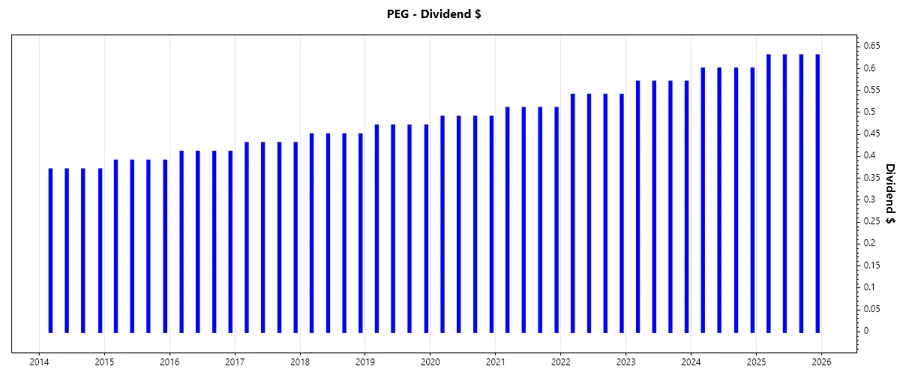
📉 Dividend History
The company’s uninterrupted dividend payments for nearly half a century underscore its commitment to rewarding shareholders, making it an attractive choice for those seeking reliability.
| Year | Dividend Per Share (USD) |
|---|---|
| 2025 | 2.52 |
| 2024 | 2.40 |
| 2023 | 2.28 |
| 2022 | 2.16 |
| 2021 | 2.04 |
📈 Dividend Growth
Dividend growth indicates the potential for future increases and reflects management's confidence in the company's operations. A steady growth signifies financial health and can outperform inflation over time.
| Time | Growth |
|---|---|
| 3 years | 5.27% |
| 5 years | 5.15% |
The average dividend growth is 5.15% over 5 years. This shows moderate but steady dividend growth.
✅ Payout Ratio
Payout ratios are vital to understanding dividend sustainability. A low ratio suggests ample room for future dividend growth, while high ratios might indicate potential dividend cuts.
| Key figure | Ratio |
|---|---|
| EPS-based | 57.56% |
| Free cash flow-based | 1642.15% |
The EPS-based payout ratio of 57.56% suggests a manageable level, aligning well with industry norms. However, the extraordinarily high free cash flow-based ratio of 1642.15% indicates a need for caution and may suggest strain if not improved.
⚠️ Cashflow & Capital Efficiency
Cash flows are instrumental in funding dividends. A positive cash flow outlook supports dividend stability and potential increases, while capital efficiency metrics reflect management’s ability to generate returns on investments.
| Year | 2024 | 2023 | 2022 |
|---|---|---|---|
| Free Cash Flow Yield | -2.96% | 1.58% | -4.54% |
| Earnings Yield | 4.21% | 8.42% | 3.38% |
| CAPEX to Operating Cash Flow | 158.46% | 87.36% | 192.15% |
| Stock-based Compensation to Revenue | 0% | 0% | 0% |
| Free Cash Flow / Operating Cash Flow Ratio | -58.46% | 12.64% | -92.15% |
The variability in free cash flow yield and the substantial capital expenditures relative to operating cash flow reflect pressures on cash resources, which may affect future dividend flexibility.
💡 Balance Sheet & Leverage Analysis
Balances sheets provide insight into a firm's financial stability and capacity to handle unforeseen operational challenges. Managing leverage effectively can help maintain financial health and lower risk.
| Year | 2024 | 2023 | 2022 |
|---|---|---|---|
| Debt-to-Equity | 1.42 | 1.32 | 1.49 |
| Debt-to-Assets | 41.89% | 40.22% | 41.95% |
| Debt-to-Capital | 58.68% | 56.87% | 59.82% |
| Net Debt to EBITDA | 5.64 | 4.00 | 7.01 |
| Current Ratio | 0.65 | 0.67 | 0.64 |
| Quick Ratio | 0.48 | 0.46 | 0.50 |
| Financial Leverage | 3.39 | 3.28 | 3.55 |
Given the high leverage ratios, the company’s financial flexibility could be constrained, highlighting the need for prudent financial management to mitigate risk and sustain dividend commitments.
🌟 Fundamental Strength & Profitability
Profitability metrics such as return on equity (ROE) and margins provide insights into the operational efficiency and the strategic outlook of the business, influencing both investor confidence and market perception.
| Year | 2024 | 2023 | 2022 |
|---|---|---|---|
| Return on Equity | 11.00% | 16.56% | 7.51% |
| Return on Assets | 3.24% | 5.05% | 2.12% |
| Net Margin | 17.22% | 22.81% | 10.52% |
| EBIT Margin | 25.91% | 33.54% | 15.97% |
| EBITDA Margin | 39.25% | 45.32% | 29.06% |
| Gross Margin | 34.41% | 42.96% | 26.57% |
| Research & Development to Revenue | 0% | 0% | 0% |
Stable profitability metrics and a consistent net margin highlight operational efficiency, yet lagging research investment could hinder innovation and future growth.
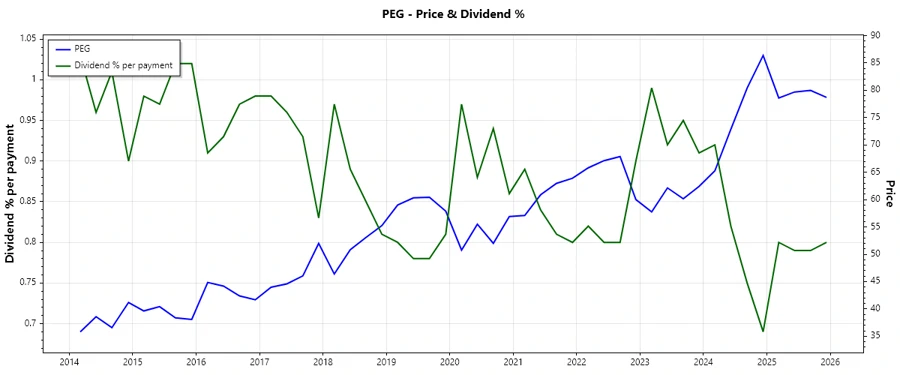
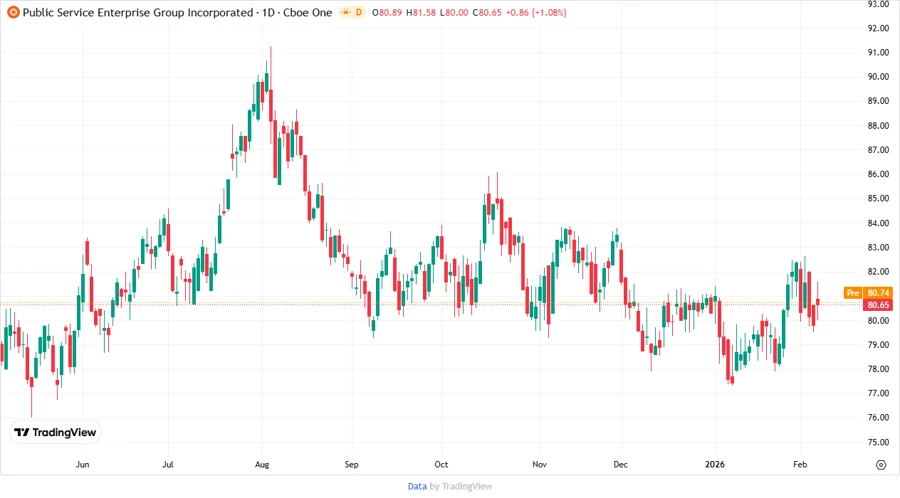
📊 Price Development
📊 Dividend Scoring System
| Criteria | Score | Score Bar |
|---|---|---|
| Dividend yield | 4 | |
| Dividend Stability | 5 | |
| Dividend growth | 3 | |
| Payout ratio | 2 | |
| Financial stability | 3 | |
| Dividend continuity | 5 | |
| Cashflow Coverage | 2 | |
| Balance Sheet Quality | 2 |
Total Score: 26/40
🗣️ Rating
The Public Service Enterprise Group Incorporated exemplifies a steadfast commitment to its dividend policy with a remarkable history of 46 years of consistent payouts. Although its steady yield and historical stability provide strong reasons for confidence, investors should be aware of the strain on free cash flow and high leverage ratios. Therefore, while the prospects for income are compelling, a cautious approach would be prudent, making it ideally suited for investors with a balanced risk tolerance seeking stable, long-term dividend income.
Smart Data Insight
Master the Perfect Entry & Exit for this Stock
Don't leave your profits to chance. Historically, this stock follows specific seasonal patterns that institutional traders use to maximize returns.
- ✅ Identify the "Golden Buying Window"
- ✅ Avoid high-risk correction cycles
- ✅ Backtested data from the last 20+ years