January 19, 2026 a 11:31 am

PEG: Dividend Analysis - Public Service Enterprise Group Incorporated
Public Service Enterprise Group Incorporated (PEG) is a strong contender in the utility sector, showing a stable dividend history with a yield of 3.20%. This company offers reliable dividends with moderate growth. With a market cap of $39.64 billion, PEG's financial standing supports its long-standing dividend history of 46 years.
Overview
Public Service Enterprise Group operates in the Utilities sector and offers a dividend yield of 3.20%. The current dividend per share is $2.40, with a robust history of 46 years without a significant cut since 1990.
| Sector | Dividend Yield (%) | Current Dividend per Share (USD) | Dividend History (Years) | Last Cut or Suspension |
|---|---|---|---|---|
| Utilities | 3.20 | 2.40 | 46 | 1990 |
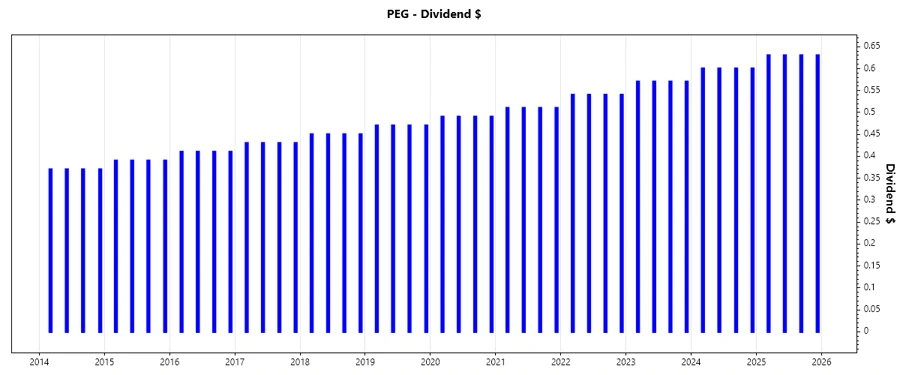
Dividend History
The dividend history reveals PEG's strong commitment to returning value to shareholders. A consistent dividend increase year-over-year is an indicator of operational and financial robustness.
| Year | Dividend per Share (USD) |
|---|---|
| 2025 | 2.52 |
| 2024 | 2.40 |
| 2023 | 2.28 |
| 2022 | 2.16 |
| 2021 | 2.04 |
Dividend Growth
PEG has demonstrated steady growth in dividends over the years, with a 3-year growth of 5.27% and a 5-year growth of 5.15%. This steady growth reflects a commitment to increasing shareholder value.
| Time | Growth (%) |
|---|---|
| 3 years | 5.27 |
| 5 years | 5.15 |
The average dividend growth is 5.15% over 5 years. This shows moderate but steady dividend growth.
Payout Ratio
The payout ratios for PEG indicate a cautious approach to dividend distribution in relation to earnings. The EPS-based payout ratio is 57.56% while the free cash flow-based payout ratio is quite high at 1642.15%.
| Key Figure | Ratio (%) |
|---|---|
| EPS-based | 57.56 |
| Free Cash Flow-based | 1642.15 |
The EPS payout ratio of 57.56% is within industry norms, indicating a sustainable dividend. However, the FCF payout ratio is extremely high, which could pose a risk to future dividend sustainability if unaddressed.
Cashflow & Capital Efficiency
Analyzing PEG’s cash flow and capital efficiency shows challenges, especially in free cash flow generation. The earnings yield and the return on invested capital are moderately stable but reveal underlying issues in cash flow management.
| Year | 2024 | 2023 | 2022 |
|---|---|---|---|
| Free Cash Flow Yield | -2.96% | 1.58% | -4.54% |
| Earnings Yield | 4.21% | 8.42% | 3.38% |
| CAPEX to Operating Cash Flow | 1.58 | 0.87 | 1.92 |
| Stock-based Compensation to Revenue | 0% | 0% | 0% |
| Free Cash Flow / Operating Cash Flow Ratio | -58.46% | 12.64% | -92.15% |
The negative free cash flow/operating cash flow ratios indicate cash flow challenges that need to be addressed to maintain financial health and support dividends.
Balance Sheet & Leverage Analysis
The company's leverage metrics reveal significant debt levels, which can impact financial stability. Monitoring these metrics is crucial for understanding the company's financial resilience and risk.
| Year | 2024 | 2023 | 2022 |
|---|---|---|---|
| Debt-to-Equity | 1.42 | 1.32 | 1.49 |
| Debt-to-Assets | 0.42 | 0.40 | 0.42 |
| Debt-to-Capital | 0.59 | 0.57 | 0.60 |
| Net Debt to EBITDA | 5.63 | 3.99 | 7.01 |
| Current Ratio | 0.65 | 0.67 | 0.64 |
| Quick Ratio | 0.48 | 0.46 | 0.50 |
| Financial Leverage | 3.39 | 3.28 | 3.55 |
The elevated leverage ratios indicate that PEG is more reliant on debt, which can impact its ability to weather economic downturns and maintain strategic flexibility.
Fundamental Strength & Profitability
Evaluating PEG's fundamental and profitability metrics provides insights into its efficiency and financial health. The return on equity and asset figures offer a glimpse into the company's ability to generate profits from its assets.
| Year | 2024 | 2023 | 2022 |
|---|---|---|---|
| Return on Equity | 10.997% | 16.560% | 7.510% |
| Return on Assets | 3.243% | 5.051% | 2.116% |
| Net Profit Margin | 17.22% | 22.81% | 10.52% |
| EBIT Margin | 25.91% | 33.54% | 15.97% |
| EBITDA Margin | 39.25% | 45.32% | 29.06% |
| Gross Margin | 34.41% | 42.96% | 26.57% |
| R&D to Revenue | 0% | 0% | 0% |
Despite stable profit margins, the variances in profitability metrics should be monitored as they reflect operational efficiencies and strategic execution.
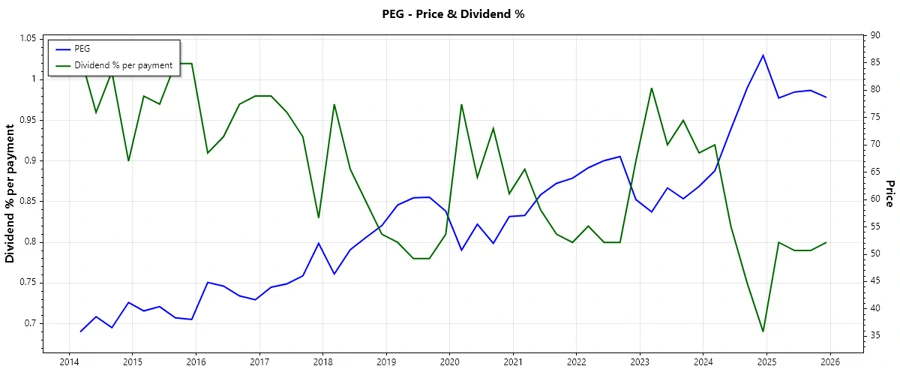
Price Development
Dividend Scoring System
| Criteria | Description | Score |
|---|---|---|
| Dividend Yield | Assessment of dividend attractiveness | |
| Dividend Stability | Consistency of dividend payments | |
| Dividend Growth | Rate and consistency of dividend growth | |
| Payout Ratio | Dividend affordability and sustainability | |
| Financial Stability | Balance sheet and debt management | |
| Dividend Continuity | Continued dividend payments | |
| Cashflow Coverage | Free cash flow adequacy | |
| Balance Sheet Quality | Assessment of balance sheet health |
Overall Score: 35/40
Rating
Based on the analysis, Public Service Enterprise Group Incorporated (PEG) is rated as a reliable dividend payer with a strong history and moderate growth. The company's leverage and cash flow metrics suggest areas for cautious monitoring, but overall, PEG presents a stable option for dividend-focused investors.