November 04, 2025 a 09:03 am
PCAR: Trend and Support & Resistance Analysis - PACCAR Inc
PACCAR Inc has shown a mixed performance over the last few months with fluctuations observed in the company's stock price. The technical indicators point toward a certain trend which could influence future trading strategies. Careful evaluation of support and resistance levels will be crucial for traders as the stock navigates current market conditions.
Trend Analysis
| Date | Close Price | Trend |
|---|---|---|
| 2025-11-03 | 97.46 | ⚖️ |
| 2025-10-31 | 98.4 | ▲ |
| 2025-10-30 | 98.82 | ▼ |
| 2025-10-29 | 98.21 | ⚖️ |
| 2025-10-28 | 99.17 | ▲ |
| 2025-10-27 | 101.08 | ▲ |
| 2025-10-24 | 100.13 | ▼ |
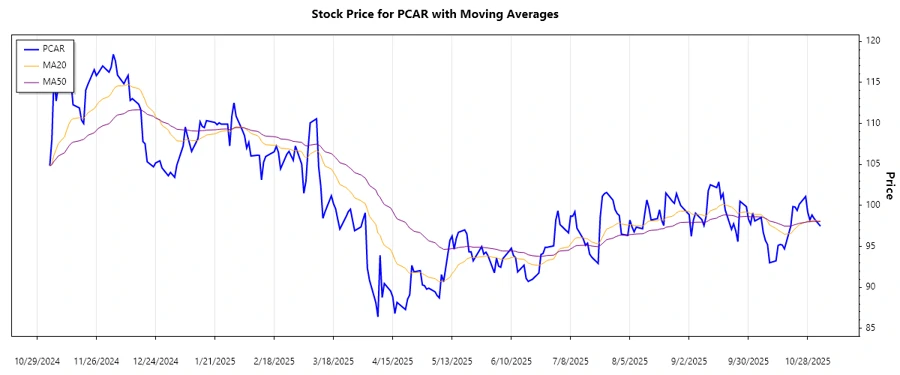
The stock shows a mixture of uptrend and downtrend signals with close prices fluctuating around moving averages. This technical perspective can assist in understanding potential breakout or reversal opportunities.
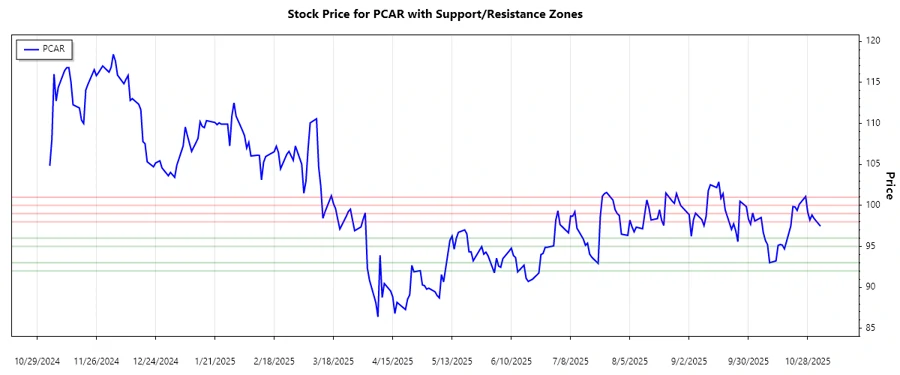
Support and Resistance
| Zone Type | From | To | Indicator |
|---|---|---|---|
| Support | 95.00 | 96.00 | ⬆️ |
| Support | 92.00 | 93.00 | ⬆️ |
| Resistance | 100.00 | 101.00 | ⬇️ |
| Resistance | 98.00 | 99.00 | ⬇️ |
Currently, the stock price is not significantly positioned within any particular zone, indicating potential volatility. Analysis here could inform strategic decisions on entry or exit points based on these technical levels.
Conclusion
PCAR Inc's recent performance illustrates the stock's positioning in a potentially sensitive market stance with mixed indicator readings across defined timeframes. Strategic trading around identified support and resistance levels could mitigate risk and harness potential upside. Despite current oscillations around key moving averages, opportunities for tactical positioning remain possible but require vigilant market monitoring.
Smart Data Insight
Master the Perfect Entry & Exit for this Stock
Don't leave your profits to chance. Historically, this stock follows specific seasonal patterns that institutional traders use to maximize returns.
- ✅ Identify the "Golden Buying Window"
- ✅ Avoid high-risk correction cycles
- ✅ Backtested data from the last 20+ years