September 19, 2025 a 06:45 am
PCAR: Fibonacci Analysis - PACCAR Inc
PACCAR Inc has shown moderate volatility in recent months. The company's broad global presence in the commercial truck market positions it uniquely to weather economic variances. Current stock performance reflects solid market adaptation and growth potential fueled by diverse revenue streams.
Fibonacci Analysis
| Detail | Value |
|---|---|
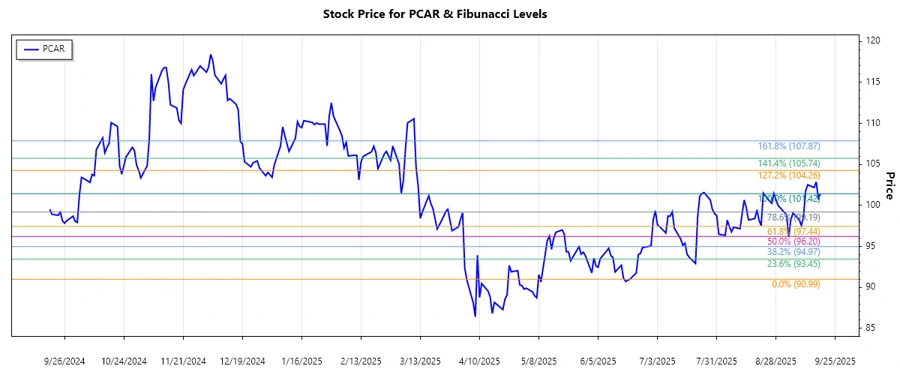
| Start Date | 2025-06-20 |
| End Date | 2025-09-10 |
| High Point (Price and Date) | $101.42 on 2025-09-18 |
| Low Point (Price and Date) | $90.99 on 2025-06-20 |
Fibonacci Level Summary
| Level | Price |
|---|---|
| 0.236 | $94.38 |
| 0.382 | $96.39 |
| 0.5 | $97.71 |
| 0.618 | $99.03 |
| 0.786 | $100.78 |
The current price of $101.42 suggests the stock is slightly above the previous high, indicating a possible breakout and no longer within a retracement zone.
Technical Interpretation: This can suggest a strong resistance break. Investors may see this as a potential buying opportunity if this level is maintained, considering broader market trends and economic conditions.
Conclusion
PACCAR Inc has demonstrated resilience in a fluctuating market due to its global market presence and diversified business units. Investors should stay vigilant for any volatility stemming from economic shifts worldwide. Current technical indicators suggest a bullish breakout above historical highs. However, caution is advised as market adaptations can lead to fluctuations. Analysts may consider observing macroeconomic conditions that influence commercial vehicle demands. Overall, PACCAR appears well-positioned for potential growth, contingent upon maintaining momentum and economic conditions stability.
Smart Data Insight
Master the Perfect Entry & Exit for this Stock
Don't leave your profits to chance. Historically, this stock follows specific seasonal patterns that institutional traders use to maximize returns.
- ✅ Identify the "Golden Buying Window"
- ✅ Avoid high-risk correction cycles
- ✅ Backtested data from the last 20+ years