February 20, 2026 a 11:31 am

PCAR: Dividend Analysis - PACCAR Inc
PACCAR Inc presents a respectable dividend profile with a current yield of 2.10% and an impressive 40-year dividend history. However, the high EPS payout ratio of over 95% warrants cautious optimism among investors. PACCAR's commitment to shareholder returns remains strong, evidenced by its consistent dividend payments even amidst fluctuating earnings. Investors should stay vigilant about the financial health and cash flow dynamics, especially considering the modest projected dividend growth.
📊 Overview
PACCAR Inc is positioned within the dynamic sector of heavy-duty trucks and vehicles, demonstrating a commitment to shareholder value through regular dividend payouts. Despite a current dividend yield of 2.10%, the company navigates challenging margins with maintained payments over the last 40 years.
| Metric | Value |
|---|---|
| Sector | Heavy-duty vehicles |
| Dividend Yield | 2.10 % |
| Current Dividend per Share | $4.31 USD |
| Dividend History | 40 years |
| Last Cut or Suspension | None |
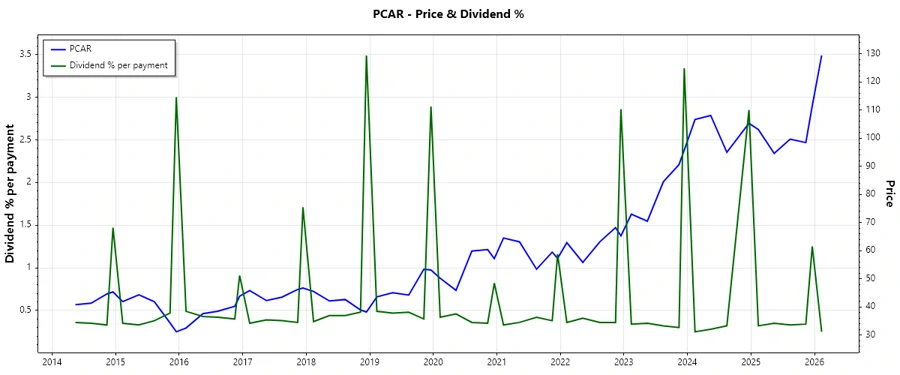
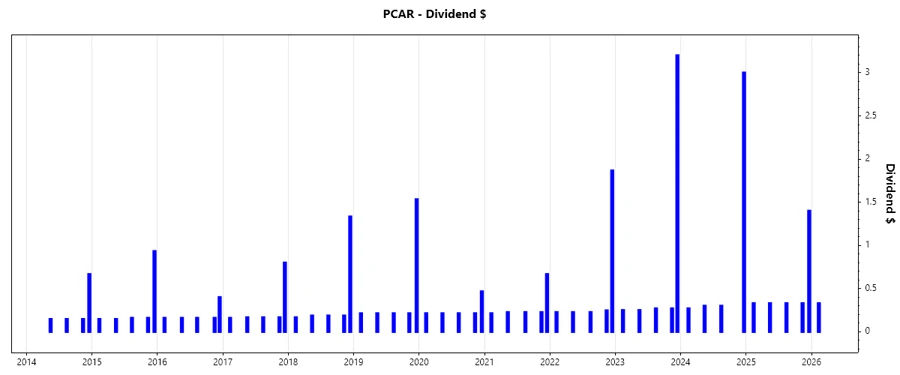
🗣️ Dividend History
PACCAR boasts a stable dividend history, indicative of robust financial management and commitment to shareholder returns. Such a track record is crucial for income-focused investors seeking reliability and gradual income growth.
| Year | Dividend per Share (USD) |
|---|---|
| 2026 | $0.33 |
| 2025 | $2.72 |
| 2024 | $3.87 |
| 2023 | $4.24 |
| 2022 | $2.79 |
📈 Dividend Growth
The growth of dividends, although moderate over longer periods, indicates a sustainable path. This growth pattern, particularly over the past 5 years, reflects resilient but careful financial strategies amidst industry fluctuations.
| Time | Growth |
|---|---|
| 3 years | -0.88 % |
| 5 years | 15.56 % |
The average dividend growth is 15.56% over 5 years. This shows moderate but steady dividend growth.
📉 Payout Ratio
The payout ratio is a vital measure of dividend sustainability. PACCAR's high EPS-based payout ratio requires attention, as it highlights potential limitations in maintaining current dividend levels amidst variable earnings.
| Key Figure | Ratio |
|---|---|
| EPS-based | 95.43 % |
| Free cash flow-based | 74.76 % |
The EPS payout ratio at 95.43% is exceedingly high, suggesting limited room for error in earnings performance, whereas the FCF-based ratio is relatively safer at 74.76%.
⚠️ Cashflow & Capital Efficiency
Analyzing cash flow and capital efficiency unveils the company's capacity to fund dividends without compromising growth initiatives. Maintaining a favorable Free Cash Flow Yield and healthy CAPEX to Operating Cash Flow ratio reflects operational efficiency.
| Metric / Year | 2025 | 2024 | 2023 |
|---|---|---|---|
| Free Cash Flow Yield | 5.26 % | 5.30 % | 5.72 % |
| Earnings Yield | 4.12 % | 7.62 % | 8.99 % |
| CAPEX to Operating Cash Flow | 31.40 % | 37.61 % | 30.13 % |
| Stock-based Compensation to Revenue | 0 % | 0 % | 0 % |
| Free Cash Flow / Operating Cash Flow Ratio | 68.60 % | 62.39 % | 69.86 % |
Stable cash flow figures and prudent capital deployment strategies indicate sustainable dividend coverage and a potential for reinvestment to drive future growth.
✅ Balance Sheet & Leverage Analysis
A robust balance sheet underpins PACCAR's ability to manage debts, thereby fostering shareholder confidence in continuous dividend payouts. Key liquidity ratios reflect strong financial resilience.
| Metric / Year | 2025 | 2024 | 2023 |
|---|---|---|---|
| Debt-to-Equity | 0 % | 90.79 % | 90.54 % |
| Debt-to-Assets | 0 % | 36.61 % | 35.22 % |
| Debt-to-Capital | 0 % | 47.59 % | 47.52 % |
| Net Debt to EBITDA | -2.20 | 1.52 | 1.05 |
| Current Ratio | 1.70 | 2.64 | 2.50 |
| Quick Ratio | 1.42 | 2.45 | 2.30 |
| Financial Leverage | 2.30 | 2.48 | 2.57 |
PACCAR's capacity to meet its short-term obligations while maintaining minimal leveraged balance positioning underlines its financial stability.
📊 Fundamental Strength & Profitability
High returns on equity and assets demonstrate PACCAR's effective management and strong profitability, crucial for sustaining distributions over the long term without undermining future growth.
| Metric / Year | 2025 | 2024 | 2023 |
|---|---|---|---|
| Return on Equity | 12.33 % | 23.77 % | 28.97 % |
| Return on Assets | 5.36 % | 9.59 % | 11.27 % |
| Margins: Net | 8.35 % | 12.36 % | 13.10 % |
| EBIT | 11.85 % | 14.53 % | 16.93 % |
| EBITDA | 14.76 % | 17.26 % | 19.56 % |
| Gross | 16.23 % | 19.93 % | 21.72 % |
| Research & Development to Revenue | 1.57 % | 1.34 % | 1.17 % |
PACCAR excels in operational efficiency with impressive ROE and ROIC, creating a benchmark for long-term profitability and dividend sustenance.
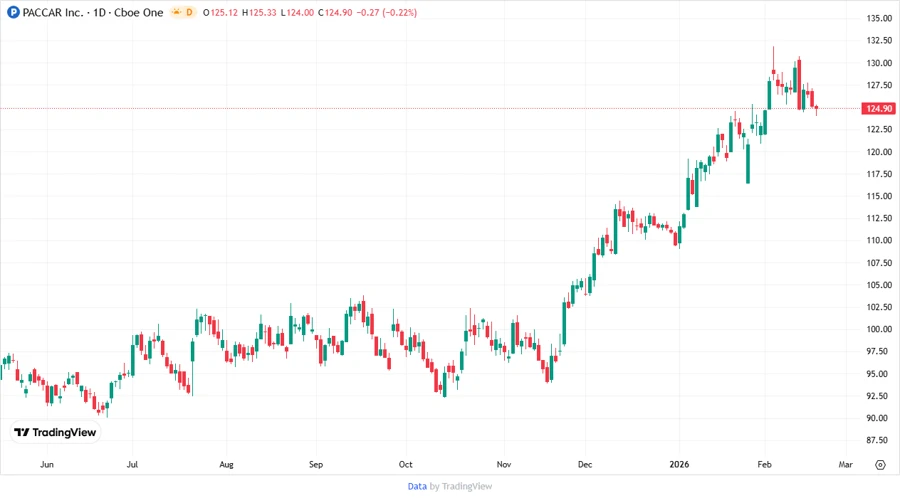
📈 Price Development
✅ Dividend Scoring System
| Criteria | Score | |
|---|---|---|
| Dividend Yield | 3 | |
| Dividend Stability | 5 | |
| Dividend Growth | 4 | |
| Payout Ratio | 2 | |
| Financial Stability | 4 | |
| Dividend Continuity | 5 | |
| Cashflow Coverage | 4 | |
| Balance Sheet Quality | 5 |
Total Score: 32/40
🗣️ Rating
PACCAR Inc ranks as a stable dividend payer with a noteworthy history of returns. The current high payout ratio might pose risks, though overall, the financial health and balance sheet strength suggest the company's capability to sustain and potentially increase dividends in the future. Thus, it is recommended for income-focused investors seeking reliability with moderate growth potential.