January 15, 2026 a 12:46 pm

PCAR: Dividend Analysis - PACCAR Inc
PACCAR Inc shows a stable financial performance with a longstanding history of continuous dividend payments. The company has maintained its dividend payouts for 40 years, indicating a robust commitment to returning value to shareholders. With a current dividend yield of 2.29% and consistent financial strength, PACCAR remains a solid investment candidate for income-seeking investors. Its recent dividend per share of $4.35 also confirms its capability to sustain shareholder returns.
📊 Overview
PACCAR Inc is a well-established player in the automotive sector. Here's a quick overview of its dividend profile:
| Metric | Detail |
|---|---|
| Sector | Automotive |
| Dividend Yield | 2.29% |
| Current Dividend per Share | 4.36 USD |
| Dividend History | 40 years |
| Last Cut or Suspension | None |
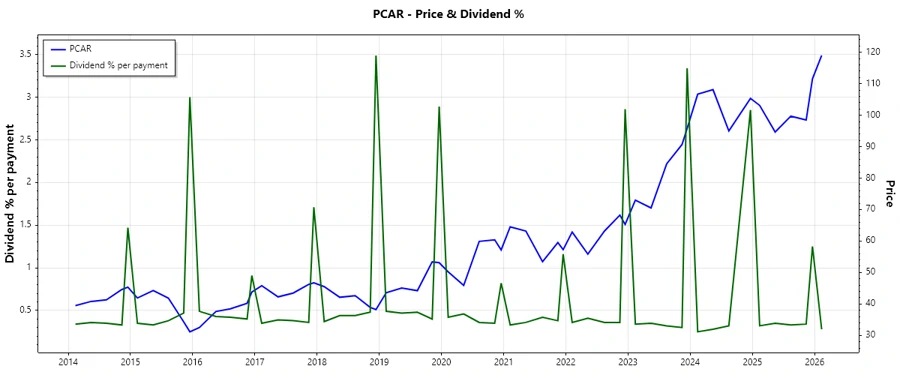
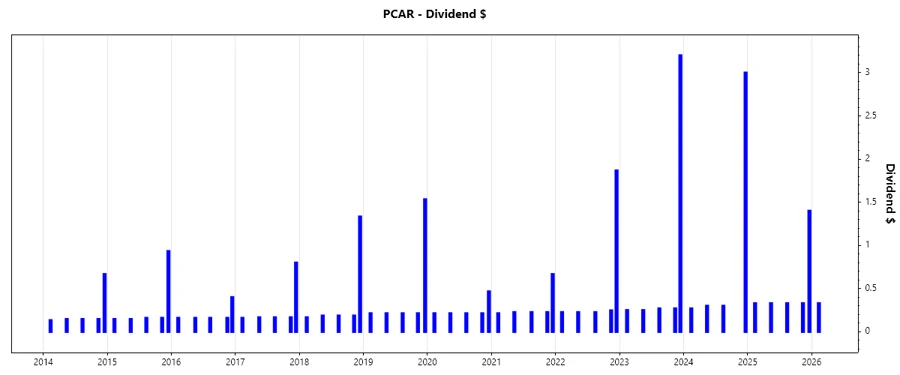
🗣️ Dividend History
Analyzing the dividend history is crucial to understanding the company's consistency in payments. A strong history suggests reliability and a shareholder-focused management.
| Year | Dividend per Share (USD) |
|---|---|
| 2026 | 0.33 |
| 2025 | 2.72 |
| 2024 | 3.87 |
| 2023 | 4.24 |
| 2022 | 2.79 |
📈 Dividend Growth
Dividend growth is a key indicator of a company's future potential and management's confidence in generating cash flows.
| Time | Growth |
|---|---|
| 3 years | -0.88% |
| 5 years | 15.56% |
The average dividend growth is 15.56% over 5 years. This shows moderate but steady dividend growth.
✅ Payout Ratio
The payout ratio is an essential measure of dividend sustainability. A high payout ratio may limit growth capital, while a low ratio suggests potential for dividend increases.
| Key Figure Ratio | Percentage |
|---|---|
| EPS-based | 85.14% |
| Free Cash Flow-based | 71.64% |
The EPS payout ratio of 85.14% indicates a high proportion of earnings paid out as dividends, suggesting potential caution in future increases. The FCF payout at 71.64% may hint at reasonable sustainability but constrains flexibility.
📉 Cashflow & Capital Efficiency
Understanding cash flow dynamics and capital efficiency helps assess the company's operational excellence and flexibility in managing its capital expenditures.
| Year | 2022 | 2023 | 2024 |
|---|---|---|---|
| Free Cash Flow Yield | 4.75% | 5.72% | 5.30% |
| Earnings Yield | 8.73% | 8.99% | 7.62% |
| CAPEX to Operating Cash Flow | 45.94% | 30.13% | 37.61% |
| Stock-based Compensation to Revenue | 0% | 0% | 0% |
| Free Cash Flow / Operating Cash Flow Ratio | 54.06% | 69.87% | 62.39% |
The company's cash flow stability and capital allocation efficiency indicate a proficient management approach in utilizing operational cash flows effectively, though there's room for enhancement in capital expenditure management ratios.
Balance Sheet & Leverage Analysis
An assessment of leverage and liquidity ratios is critical for evaluating the firm's financial health, risk exposure, and ability to meet debt obligations.
| Year | 2022 | 2023 | 2024 |
|---|---|---|---|
| Debt-to-Equity | 0.89 | 0.91 | 0.91 |
| Debt-to-Assets | 0.35 | 0.35 | 0.37 |
| Debt-to-Capital | 0.47 | 0.48 | 0.48 |
| Net Debt to EBITDA | 1.56 | 1.05 | 1.52 |
| Current Ratio | 2.60 | 2.50 | 2.64 |
| Quick Ratio | 2.37 | 2.30 | 2.46 |
| Financial Leverage | 2.53 | 2.57 | 2.48 |
The advanced debt ratios highlight PACCAR's commitment to maintaining a sound balance sheet with moderate leverage, preserving its ability to utilize financial resources efficiently.
Fundamental Strength & Profitability
Examining profitability margins and returns provides insights into the company's operational efficiency and profitability potential.
| Year | 2022 | 2023 | 2024 |
|---|---|---|---|
| Return on Equity | 22.87% | 28.97% | 23.77% |
| Return on Assets | 9.05% | 11.27% | 9.59% |
| Net Margin | 10.45% | 13.10% | 12.36% |
| EBIT Margin | 12.76% | 16.93% | 14.53% |
| EBITDA Margin | 15.51% | 19.56% | 17.26% |
| Gross Margin | 18.14% | 21.72% | 19.93% |
| R&D to Revenue | 1.18% | 1.17% | 1.34% |
The company’s strong returns on equity, assets, and margins reflect its adept management and competitive position in the industry, highlighting good profitability prospects.
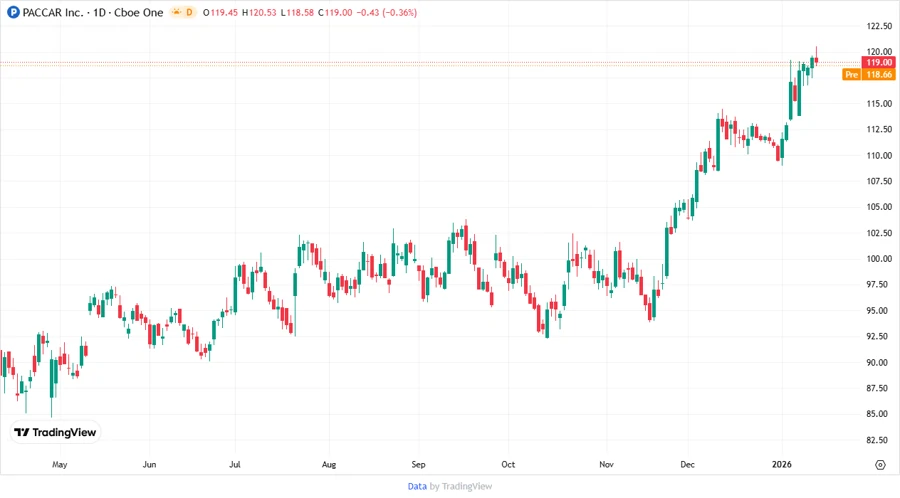
Price Development
Dividend Scoring System
| Criterion | Score | Bar |
|---|---|---|
| Dividend Yield | 3 | |
| Dividend Stability | 5 | |
| Dividend Growth | 3 | |
| Payout Ratio | 3 | |
| Financial Stability | 4 | |
| Dividend Continuity | 5 | |
| Cashflow Coverage | 4 | |
| Balance Sheet Quality | 4 |
Overall Score: 31/40
Rating
Based on the comprehensive analysis of PACCAR Inc's dividend history, growth potential, and financial robustness, it is recommended as a viable investment for dividend investors who appreciate stability and moderate growth. With an overall score of 31 out of 40, PACCAR Inc positions itself as a reliable and profitable addition to a diversified dividend portfolio.