November 23, 2025 a 11:31 am

PCAR: Dividend Analysis - PACCAR Inc
PACCAR Inc presents an appealing dividend profile characterized by a stable and gradually increasing payout. With a significant market cap and strong market presence, the company has built a reliable track record for distributing dividends. As an established player in its sector, PACCAR is positioned to maintain and potentially enhance shareholder value through consistent dividend yields.
📊 Overview
The following table provides a snapshot of PACCAR Inc's key dividend indicators, illustrating their sector presence and dividend metrics.
| Metric | Value |
|---|---|
| Sector | Automotive |
| Dividend yield | 4.39% |
| Current dividend per share | 4.36 USD |
| Dividend history | 39 years |
| Last cut or suspension | None |
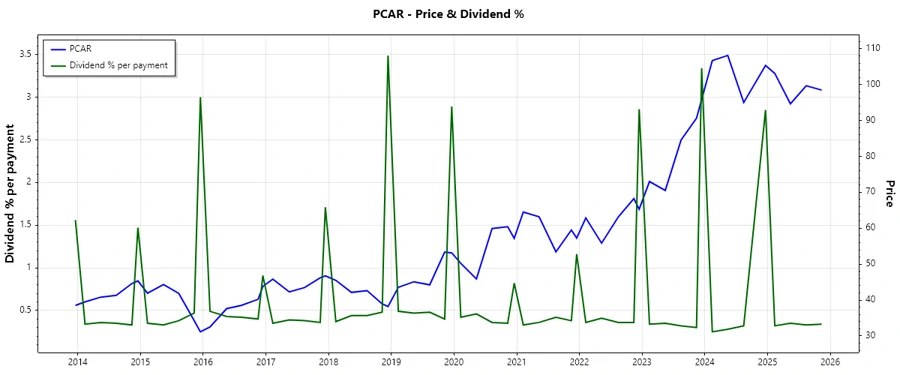
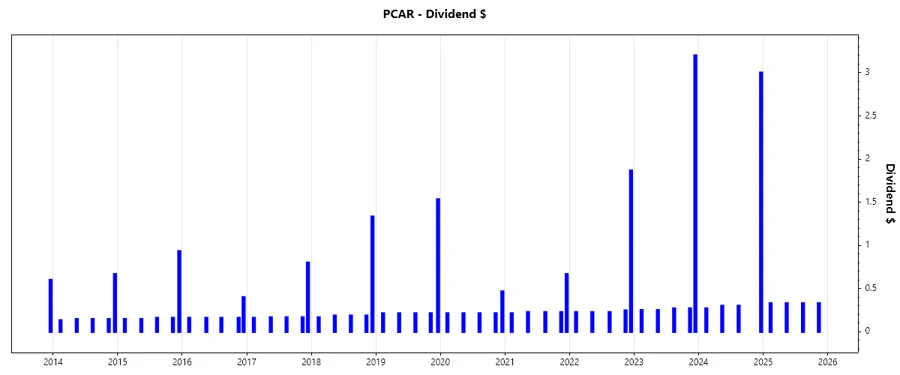
📈 Dividend History
PACCAR Inc has an impressive dividend history spanning 39 years. This consistency signifies financial stability and an unwavering commitment to returning capital to shareholders.
This chart provides a visual representation of dividend payments over time, underscoring PACCAR's commitment to shareholder returns.
| Year | Dividend per Share |
|---|---|
| 2025 | 1.32 |
| 2024 | 3.87 |
| 2023 | 4.24 |
| 2022 | 2.79 |
| 2021 | 1.56 |
📉 Dividend Growth
The growth rates over the last few years highlight PACCAR's ability to enhance dividend payouts, reflecting robust cash flow generation and strategic financial policies.
| Time | Growth |
|---|---|
| 3 years | 0.35% |
| 5 years | 0.10% |
The average dividend growth is 0.10% over 5 years. This shows moderate but steady dividend growth.
✅ Payout Ratio
Understanding the payout ratio is critical for assessing the sustainability of PACCAR's dividend policy.
| Key figure | Ratio |
|---|---|
| EPS-based | 85.14% |
| Free cash flow-based | 71.64% |
With an EPS payout of 85.14% and a Free Cash Flow payout of 71.64%, the ratios display cautious yet generous distributor commitments.
Cashflow & Capital Efficiency
A critical component of assessing financial health is analyzing cash flow and capital efficiency metrics.
| Metric | 2023 | 2022 | 2024 |
|---|---|---|---|
| Free Cash Flow Yield | 5.72% | 4.75% | 5.30% |
| Earnings Yield | 9.00% | 8.73% | 7.62% |
| CAPEX to Operating Cash Flow | 30.13% | 45.94% | 37.61% |
| Stock-based Comp to Revenue | 0% | 0% | 0% |
| Free Cash Flow / Operating Cash Flow | 0.70% | 0.54% | 0.62% |
These metrics show stability and efficient capital allocation, ensuring substantial returns on invested capital.
Balance Sheet & Leverage Analysis
A strong balance sheet is pivotal for long-term financial sustainability. PACCAR's leverage ratios reveal moderate risk levels, vital for dividend consistency.
| Metric | 2023 | 2022 | 2024 |
|---|---|---|---|
| Debt-to-Equity | 0.91 | 0.89 | 0.91 |
| Debt-to-Assets | 0.35 | 0.35 | 0.37 |
| Debt-to-Capital | 0.48 | 0.47 | 0.48 |
| Net Debt to EBITDA | 1.09 | 1.50 | 1.39 |
| Current Ratio | 2.50 | 2.60 | 2.64 |
| Quick Ratio | 2.30 | 2.37 | 2.46 |
| Financial Leverage | 2.57 | 2.53 | 2.48 |
These figures indicate a well-managed debt structure supporting strong financial robustness.
Fundamental Strength & Profitability
Evaluating profitability margins provides insight into operational efficiency and profitability potential, critical for sustaining and growing dividends.
| Metric | 2023 | 2022 | 2024 |
|---|---|---|---|
| Return on Equity | 28.97% | 22.87% | 23.77% |
| Return on Assets | 11.27% | 9.05% | 9.59% |
| Net Margin | 13.09% | 10.44% | 12.37% |
| EBIT Margin | 16.28% | 13.32% | 16.14% |
| Gross Margin | 20.62% | 16.45% | 18.94% |
| R&D to Revenue | 1.17% | 1.18% | 1.35% |
Conclusion: PACCAR exhibits strong profitability metrics, underscoring its ability to sustain impressive dividend growth.
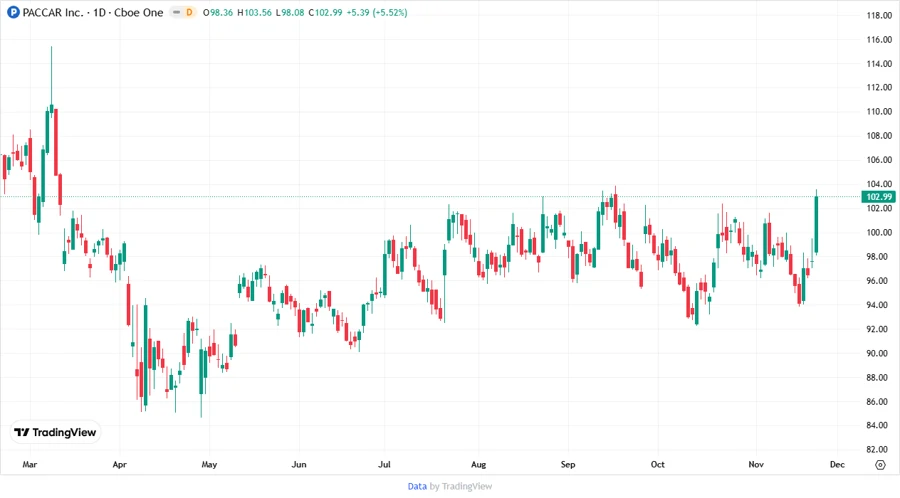
Price Development
🗣️ Dividend Scoring System
Our custom dividend scoring evaluates PACCAR across key dividend- and financially-related metrics.
| Criteria | Score | |
|---|---|---|
| Dividend yield | 4/5 | |
| Dividend Stability | 5/5 | |
| Dividend growth | 3/5 | |
| Payout ratio | 3/5 | |
| Financial stability | 4/5 | |
| Dividend continuity | 5/5 | |
| Cashflow Coverage | 3/5 | |
| Balance Sheet Quality | 4/5 |
Overall Score: 31/40
Rating
Based on the analysis, PACCAR Inc maintains a robust dividend profile supported by strong fundamentals and stable financial metrics. The recommendation for dividend-focused investors is to consider PACCAR for its consistent dividend yield, reliable financial structure, and strategic growth potential amid steady market conditions.
Smart Data Insight
Master the Perfect Entry & Exit for this Stock
Don't leave your profits to chance. Historically, this stock follows specific seasonal patterns that institutional traders use to maximize returns.
- ✅ Identify the "Golden Buying Window"
- ✅ Avoid high-risk correction cycles
- ✅ Backtested data from the last 20+ years