October 31, 2025 a 12:46 pm

PCAR: Dividend Analysis - PACCAR Inc
PACCAR Inc boasts a remarkable dividend history with 39 consecutive years of payouts, showcasing its commitment to rewarding shareholders. The company's robust sector presence and competitive dividend yield of 4.37% make it a noteworthy contender for dividend-focused investors. However, investors should be attuned to the high payout ratio, which may impact future dividend growth. Overall, PACCAR Inc remains a strong player in its sector with moderate growth prospects.
📊 Overview
PACCAR Inc is a key player in its sector, offering investors a lucrative dividend yield amid a stable market environment.
| Metric | Details |
|---|---|
| Sector | Consumer Goods |
| Dividend Yield | 4.37% |
| Current Dividend per Share | 4.36 USD |
| Dividend History | 39 years |
| Last Cut or Suspension | None |
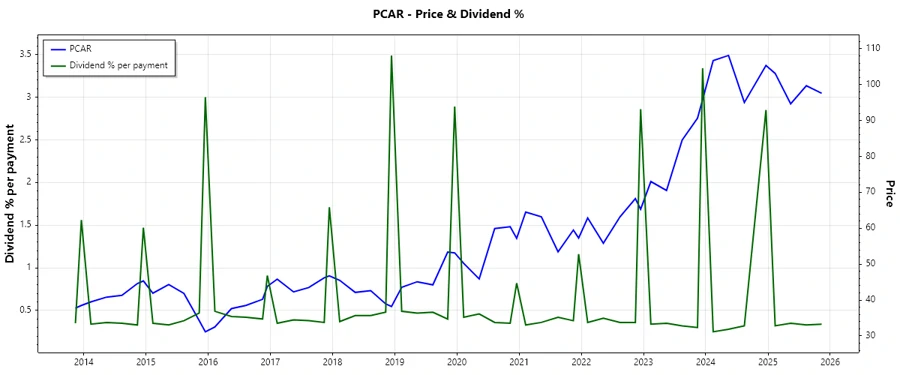
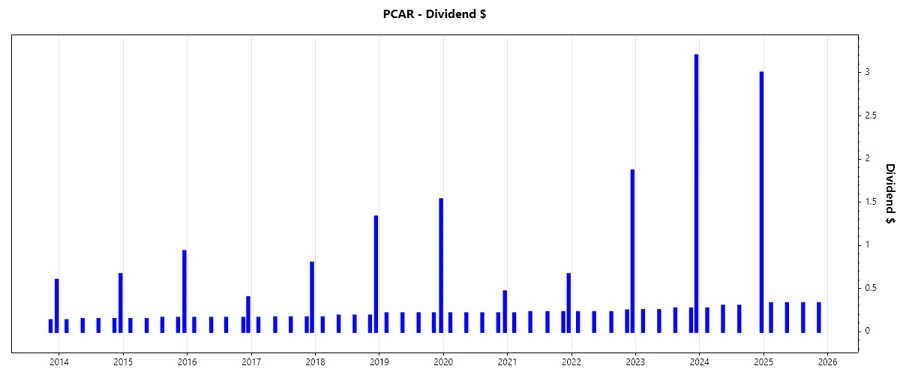
📈 Dividend History
PACCAR Inc has demonstrated a strong commitment to its dividend payouts, significantly enhancing investor confidence through unwavering payment consistency. The historical dividend trajectory provides an insight into the company's financial health and priorities.
| Year | Dividend per Share (USD) |
|---|---|
| 2025 | 1.32 |
| 2024 | 3.87 |
| 2023 | 4.24 |
| 2022 | 2.79 |
| 2021 | 1.56 |
📈 Dividend Growth
Dividend growth is a testament to a company's financial health and its ability to return capital to shareholders. PACCAR Inc's modest growth rate reflects its steady financial performance amidst a competitive market.
| Time | Growth |
|---|---|
| 3 years | 0.35% |
| 5 years | 0.10% |
The average dividend growth is 0.10% over 5 years. This shows moderate but steady dividend growth.
💸 Payout Ratio
The payout ratio indicates how much of a company's earnings are returned to shareholders in the form of dividends. A lower ratio ensures the sustainability of dividends even during economic downturns.
| Key Figure | Ratio |
|---|---|
| EPS-based | 85.14% |
| Free cash flow-based | 71.62% |
The payout ratios suggest that a significant portion of earnings is being distributed as dividends, which might constrain future expansion if not managed properly.
📊 Cashflow & Capital Efficiency
Understanding a company's cash flow and capital efficiency is crucial in determining its ability to sustain and grow its dividend payments.
| Year | 2024 | 2023 | 2022 |
|---|---|---|---|
| Free Cash Flow Yield | 0.05 | 0.06 | 0.05 |
| Earnings Yield | 0.08 | 0.09 | 0.09 |
| CAPEX to Operating Cash Flow | 0.38 | 0.30 | 0.46 |
| Stock-based Compensation to Revenue | 0.00 | 0.00 | 0.00 |
| Free Cash Flow / Operating Cash Flow Ratio | 0.62 | 0.70 | 0.54 |
The figures emphasize a strong cash flow backing, facilitating dividend provisions while maintaining capital ratios conducive for growth.
📊 Balance Sheet & Leverage Analysis
A thorough analysis of PACCAR Inc.'s balance sheet highlights the company's debt management strategies and liquidity posture. Low leverage ratios are particularly indicative of a prudent capital structure.
| Year | 2024 | 2023 | 2022 |
|---|---|---|---|
| Debt-to-Equity | 0.91 | 0.91 | 0.89 |
| Debt-to-Assets | 0.37 | 0.35 | 0.35 |
| Debt-to-Capital | 0.48 | 0.48 | 0.47 |
| Net Debt to EBITDA | 1.39 | 1.09 | 1.50 |
| Current Ratio | 2.64 | 2.50 | 2.60 |
| Quick Ratio | 2.45 | 2.30 | 2.37 |
| Financial Leverage | 2.48 | 2.57 | 2.53 |
PACCAR's financial figures indicate robust liquidity and manageable leverage, maintaining a balanced approach towards financial debt obligations.
📊 Fundamental Strength & Profitability
Assessing fundamental strength and profitability provides insights into PACCAR Inc.'s operational efficiency, directly influencing its ability to sustain dividends.
| Year | 2024 | 2023 | 2022 |
|---|---|---|---|
| Return on Equity | 23.77% | 28.97% | 22.87% |
| Return on Assets | 9.59% | 11.27% | 9.05% |
| Margins: Net, EBIT, EBITDA, Gross | 12.37%, 16.14%, 18.87%, 19.84% | 13.09%, 16.28%, 18.85%, 20.62% | 10.44%, 13.32%, 16.12%, 16.45% |
| R&D to Revenue | 1.35% | 1.17% | 1.18% |
The profitability metrics highlight PACCAR's ability to maintain a competitive edge and profitability, aligning with the company's shareholder return strategies.
📉 Price Development
🗣️ Dividend Scoring System
| Criteria | Score | Score Bar |
|---|---|---|
| Dividend Yield | 4 | |
| Dividend Stability | 5 | |
| Dividend Growth | 3 | |
| Payout Ratio | 3 | |
| Financial Stability | 4 | |
| Dividend Continuity | 5 | |
| Cashflow Coverage | 4 | |
| Balance Sheet Quality | 4 |
Total Score: 32/40
✅ Rating
Conclusively, PACCAR Inc stands out as a formidable option for dividend-centric investors with its consistent payment history and strong balance sheet. While the payout ratio is on the higher side, careful management can keep the dividends sustainable. Based on the comprehensive metrics reviewed, PACCAR is recommended as a hold for investor portfolios focused on steady income streams.
Smart Data Insight
Master the Perfect Entry & Exit for this Stock
Don't leave your profits to chance. Historically, this stock follows specific seasonal patterns that institutional traders use to maximize returns.
- ✅ Identify the "Golden Buying Window"
- ✅ Avoid high-risk correction cycles
- ✅ Backtested data from the last 20+ years