October 17, 2025 a 11:31 am


PCAR: Dividend Analysis - PACCAR Inc
PACCAR Inc, a leader in its sector, showcases a robust dividend profile with a yield of 4.54% and a remarkable 39-year dividend history. The company has consistently maintained its dividend payments, indicating financial stability and a commitment to shareholder returns. Despite a high payout ratio, PACCAR's dividend growth over the past five years shows gradual improvement, underpinned by a strong balance sheet and effective capital allocation strategies.
📊 Overview
PACCAR Inc operates in a sector known for its cyclical nature, yet it has managed to deliver steady dividend payments over nearly four decades. The current dividend yield is an attractive 4.54%, supported by a per-share distribution of $4.36. Notably, there have been no recent suspensions or cuts, reinforcing the company's reliability in dividend distributions.
| Metric | Value |
|---|---|
| Sector | Industrials |
| Dividend yield | 4.54% |
| Current dividend per share | 4.36 USD |
| Dividend history | 39 years |
| Last cut or suspension | None |
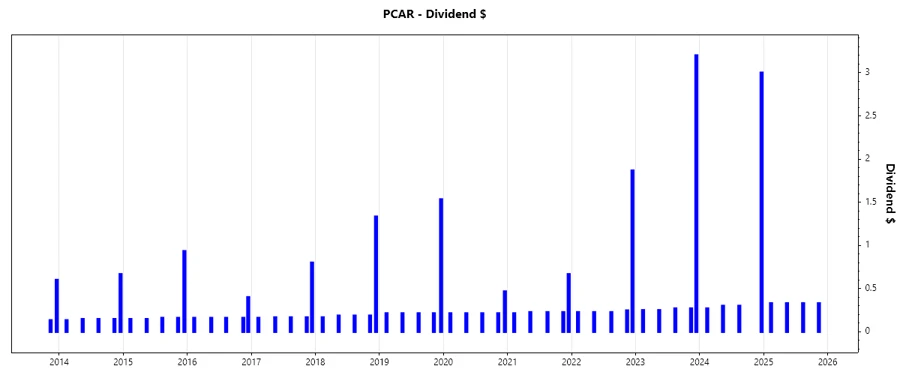
🗣️ Dividend History
The company has shown resilience during economic cycles, which is evident from its long dividend history. The stability of its dividends is critical for risk-averse investors looking for reliable income over time.
| Year | Dividend per Share |
|---|---|
| 2025 | 1.32 |
| 2024 | 3.87 |
| 2023 | 4.24 |
| 2022 | 2.79 |
| 2021 | 1.56 |
📈 Dividend Growth
Dividend growth is a crucial indicator for yielding increased future returns. Over the past three years, PACCAR's dividend growth rate was merely 0.35%, whereas the five-year growth was 0.10%, indicating moderate progress.
| Time | Growth |
|---|---|
| 3 years | 0.35% |
| 5 years | 0.10% |
The average dividend growth is 0.10% over 5 years. This shows moderate but steady dividend growth.
📉 Payout Ratio
The payout ratio measures the proportion of earnings distributed as dividends. PACCAR's EPS-based payout ratio stands at a healthy 74.56%, demonstrating an ability to cover dividends with earnings. However, the free cash flow-based ratio is slightly higher, at 79.43%, suggesting less flexibility with cash flow reserves.
| Key figure | Ratio |
|---|---|
| EPS-based | 74.56% |
| Free cash flow-based | 79.43% |
Both the EPS and FCF payout ratios demonstrate PACCAR's commitment to its dividends, while indicating the need for careful balance in between earnings reinvestment and dividend payments.
✅ Cashflow & Capital Efficiency
Examining the company's cashflow and capital efficiency reveals its potential for sustainable payout policies. Important metrics such as Free Cash Flow Yield and CAPEX to Operating Cash Flow highlight its liquidity and operational efficiency, whereas Stock-based Compensation to Revenue remains at 0%, displaying cost-effective operations.
| Metric | 2022 | 2023 | 2024 |
|---|---|---|---|
| Free Cash Flow Yield | 4.75% | 5.72% | 5.30% |
| Earnings Yield | 8.73% | 8.99% | 7.62% |
| CAPEX to Operating Cash Flow | 45.94% | 30.13% | 37.61% |
| Stock-based Compensation to Revenue | 0% | 0% | 0% |
| Free Cash Flow / Operating Cash Flow Ratio | 54.06% | 69.87% | 62.39% |
These data points suggest robust cash flows and effective capital allocation, supporting long-term dividend sustainability and competitiveness in the industry.
📊 Balance Sheet & Leverage Analysis
Analysing the balance sheet and leverage helps assess PACCAR's financial stability and debt management. Key ratios like Debt-to-Equity and Current Ratios offer insights into their funding structure and liquidity position.
| Metric | 2022 | 2023 | 2024 |
|---|---|---|---|
| Debt-to-Equity | 0.89 | 0.91 | 0.91 |
| Debt-to-Assets | 35.10% | 35.22% | 36.61% |
| Debt-to-Capital | 47.01% | 47.52% | 47.59% |
| Net Debt to EBITDA | 1.50 | 1.09 | 1.39 |
| Current Ratio | 2.60 | 2.50 | 2.64 |
| Quick Ratio | 2.37 | 2.30 | 2.45 |
| Financial Leverage | 2.53 | 2.57 | 2.48 |
The company's solid balance sheet ratios highlight its strong financial health and manageable leverage, ensuring it remains well-positioned to meet obligations while continuing dividend payouts.
📈 Fundamental Strength & Profitability
Analysis of fundamental strength through profitability metrics like Return on Equity and Margin Ratios gives insights into operational efficacy and value generation capacity.
| Metric | 2022 | 2023 | 2024 |
|---|---|---|---|
| Return on Equity | 22.87% | 28.97% | 23.77% |
| Return on Assets | 9.05% | 11.27% | 9.59% |
| Net Margin | 10.44% | 13.09% | 12.37% |
| EBIT Margin | 13.32% | 16.28% | 16.14% |
| EBITDA Margin | 16.12% | 18.85% | 18.87% |
| Gross Margin | 16.45% | 20.62% | 18.94% |
| Research & Development to Revenue | 1.18% | 1.17% | 1.35% |
These metrics indicate that PACCAR is efficiently generating returns on its investments and is committed to innovation and growth through substantial R&D spending, a positive indicator for future profitability and competitive positioning.
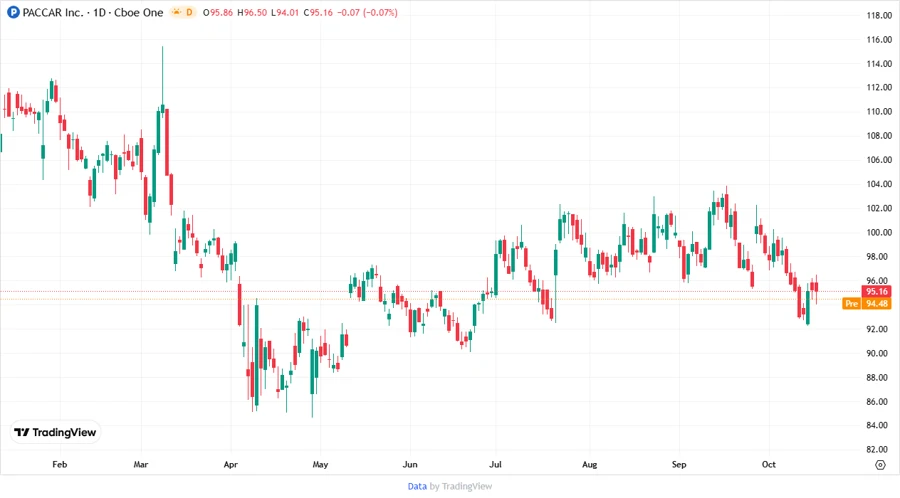
📊 Price Development
🗣️ Dividend Scoring System
| Criteria | Score | Score Bar |
|---|---|---|
| Dividend Yield | 4 | |
| Dividend Stability | 5 | |
| Dividend Growth | 3 | |
| Payout Ratio | 3 | |
| Financial Stability | 4 | |
| Dividend Continuity | 5 | |
| Cashflow Coverage | 4 | |
| Balance Sheet Quality | 4 |
Total Score: 32/40
🗣️ Rating
PACCAR Inc offers a compelling dividend profile, marked by a substantial yield and decade-spanning stability. While dividend growth appears modest, its consistency and robust cash flow position make it a reliable income stock in the industrials sector. Investors seeking steady dividends with lower volatility would find PACCAR an attractive addition to their portfolios.
Smart Data Insight
Master the Perfect Entry & Exit for this Stock
Don't leave your profits to chance. Historically, this stock follows specific seasonal patterns that institutional traders use to maximize returns.
- ✅ Identify the "Golden Buying Window"
- ✅ Avoid high-risk correction cycles
- ✅ Backtested data from the last 20+ years