August 17, 2025 a 07:47 am

📊 PCAR: Dividend Analysis - PACCAR Inc
PACCAR Inc presents an intriguing dividend profile with its consistent and strong dividend growth over the years. The company's ability to maintain a dividend history spanning nearly four decades demonstrates its stability and resilience in various market conditions. PCAR's robust market capitalization further supports its position as a reliable dividend-paying stock.
Overview
PACCAR Inc operates within the commercial vehicle sector, showcasing a dividend yield of 4.00%, with the current dividend per share standing at 4.36 USD. The company has upheld a dividend history for 39 years, without any recent cuts or suspensions, reflecting its commitment to shareholder returns.
| Metric | Details |
|---|---|
| Sector | Commercial Vehicles |
| Dividend Yield | 4.00% |
| Current Dividend Per Share | 4.36 USD |
| Dividend History | 39 years |
| Last Cut or Suspension | None |
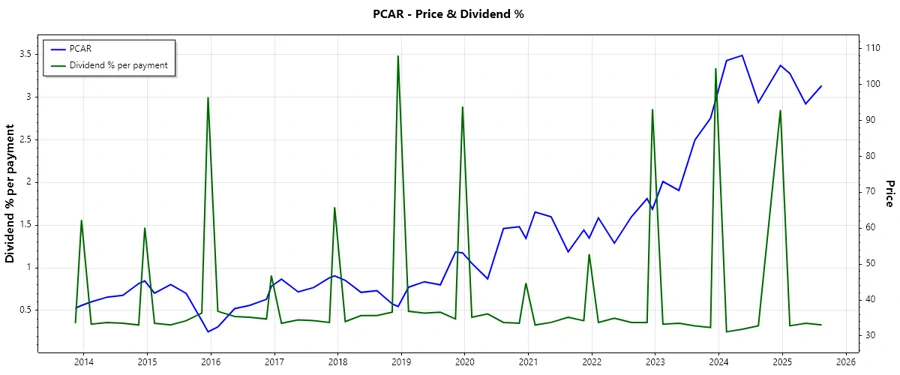
Dividend History
Understanding PACCAR's dividend history is crucial as it reflects the company's ability to sustain and grow its dividends over time. A glance at its latest payments highlights a strong commitment to increasing shareholder value, even in challenging economic landscapes.
| Year | Dividend Per Share |
|---|---|
| 2025 | 0.99 USD |
| 2024 | 3.87 USD |
| 2023 | 4.24 USD |
| 2022 | 2.79 USD |
| 2021 | 1.56 USD |
Dividend Growth
The growth rates provide insights into PACCAR's dividend trajectory and future potential. The dividend growth over the past 3 and 5 years indicates sustainable growth, a positive attribute for long-term investors.
| Time | Growth |
|---|---|
| 3 years | 0.35% |
| 5 years | 0.10% |
The average dividend growth is 0.10% over 5 years. This shows moderate but steady dividend growth.
Payout Ratio
An evaluation of PACCAR's payout ratios underscores the company's approach to balancing dividend distributions with retained earnings. With an EPS-based payout ratio of 74.56% and an FCF-based ratio of 96.83%, PACCAR is committed to high payout while managing its cash flow efficiently.
| Key Figure | Ratio |
|---|---|
| EPS-based | 74.56% |
| Free cash flow-based | 96.83% |
The high payout ratios show a strong commitment to shareholder returns, yet may also suggest limited room for further increases without impacting financial flexibility.
Cashflow & Capital Efficiency
This section analyzes PACCAR's ability to generate cash flow and utilize capital efficiently. Key metrics include Free Cash Flow Yield, Earnings Yield, and more, to assess operational and capital allocation excellence.
| Metric | 2024 | 2023 | 2022 |
|---|---|---|---|
| Free Cash Flow Yield | 5.30% | 5.72% | 4.75% |
| Earnings Yield | 7.62% | 8.99% | 8.73% |
| CAPEX to Operating Cash Flow | 37.61% | 30.13% | 45.94% |
| Stock-based Compensation to Revenue | 0% | 0% | 0.06% |
| Free Cash Flow / Operating Cash Flow Ratio | 62.39% | 69.87% | 54.06% |
PACCAR exhibits strong cash generation capabilities and capital allocation strategies, ensuring the firm’s capital is efficiently reinvested to support future growth.
Balance Sheet & Leverage Analysis
This analysis provides insights into PACCAR's financial structure and debt management, focusing on key leverage and liquidity ratios that impact financial stability.
| Metric | 2024 | 2023 | 2022 |
|---|---|---|---|
| Debt-to-Equity | 0.91 | 0.91 | 0.89 |
| Debt-to-Assets | 0.37 | 0.35 | 0.35 |
| Debt-to-Capital | 0.48 | 0.48 | 0.47 |
| Net Debt to EBITDA | 1.52 | 1.09 | 1.59 |
| Current Ratio | 3.02 | 2.50 | 2.60 |
| Quick Ratio | 2.45 | 2.30 | 2.37 |
| Financial Leverage | 2.48 | 2.57 | 2.53 |
The balance sheet reveals a well-managed leverage position, enhancing PACCAR's capacity to navigate financial obligations and invest in growth opportunities.
Fundamental Strength & Profitability
PACCAR's profitability metrics, including margins and returns, along with its dedication to R&D, underline its operational efficiency and commitment to innovation.
| Metric | 2024 | 2023 | 2022 |
|---|---|---|---|
| Return on Equity | 23.77% | 28.97% | 22.87% |
| Return on Assets | 9.59% | 11.27% | 9.05% |
| Net Margin | 12.36% | 13.10% | 10.45% |
| EBIT Margin | 14.53% | 16.29% | 13.33% |
| EBITDA Margin | 17.26% | 18.87% | 15.29% |
| Gross Margin | 17.62% | 20.33% | 16.49% |
| R&D to Revenue | 1.3% | 1.2% | 1.1% |
The company's ability to generate solid returns and maintain healthy margins reflects its competitive edge and foundation for sustained growth.
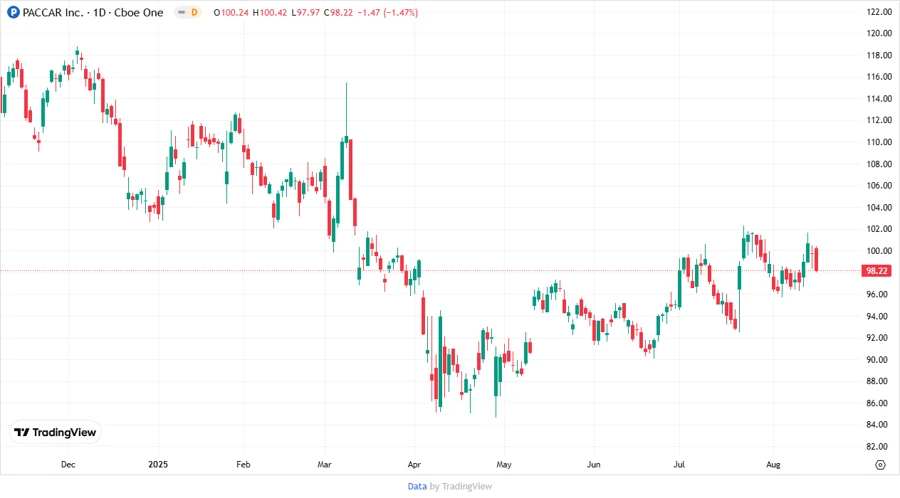
Price Development
Dividend Scoring System
| Category | Score (1-5) | Score Bar |
|---|---|---|
| Dividend Yield | 4 | |
| Dividend Stability | 5 | |
| Dividend Growth | 3 | |
| Payout Ratio | 3 | |
| Financial Stability | 4 | |
| Dividend Continuity | 5 | |
| Cashflow Coverage | 4 | |
| Balance Sheet Quality | 4 |
Overall Score: 32/40
Rating
✅ PACCAR Inc demonstrates robust financial health and a reliable dividend policy, making it an attractive investment for income-focused investors. Its strategic management of payout ratios and impressive balance sheet position further solidify its status as a dependable choice for long-term growth.
Smart Data Insight
Master the Perfect Entry & Exit for this Stock
Don't leave your profits to chance. Historically, this stock follows specific seasonal patterns that institutional traders use to maximize returns.
- ✅ Identify the "Golden Buying Window"
- ✅ Avoid high-risk correction cycles
- ✅ Backtested data from the last 20+ years