
June 23, 2026 a 11:44 am

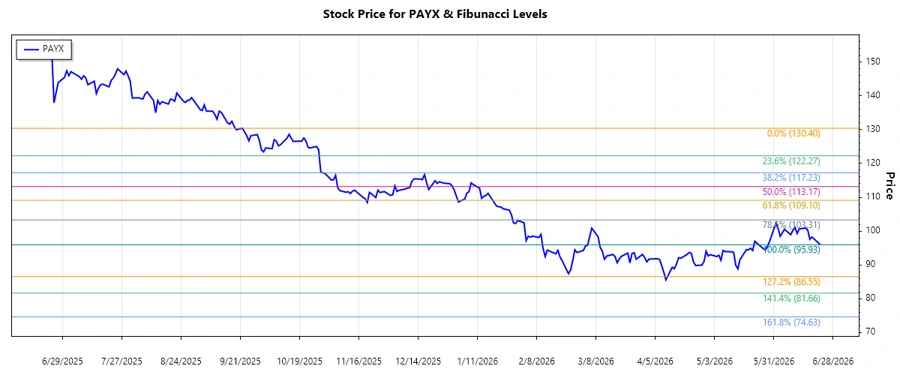
PAYX: Fibonacci Analysis - Paychex, Inc.
Paychex, Inc. has shown a significant downward trend over the past few months. Given its comprehensive suite of human capital management solutions, the company remains fundamental in supporting SMEs across various regions. However, recent trends indicate a declining stock price, raising caution among investors. A technical analysis using Fibonacci retracement levels can provide insights into potential support and resistance areas.
Fibonacci Analysis
The analysis studies the recent downward trend from September 22, 2025 with a high price of $130.40 to June 22, 2026 with a low price of $95.93.
| Fibonacci Level | Price Level |
|---|---|
| 0.236 | $103.37 |
| 0.382 | $108.54 |
| 0.5 | $113.17 |
| 0.618 | $117.81 |
| 0.786 | $124.22 |
The current stock price is $95.93, which indicates it is below the 0.236 retracement level, suggesting it remains in a bearish range.
Conclusion: The stock price is below all significant retracement levels, indicating strong bearish momentum. Potential support might form at these Fibonacci levels as prices could retrace part of the recent downtrend.
Conclusion
The recent downtrend in Paychex, Inc.'s stock suggests a bearish outlook in the near term. Despite the company's solid business model and essential services for SMEs, external market pressures, and sentiments might be impacting the stock performance. Fibonacci retracement levels suggest key price points for potential recovery, which analysts should monitor closely. However, current prices are below these support zones, reinforcing the need for cautious optimism and vigilance in market developments.
Smart Data Insight
Master the Perfect Entry & Exit for this Stock
Don't leave your profits to chance. Historically, this stock follows specific seasonal patterns that institutional traders use to maximize returns.
- ✅ Identify the "Golden Buying Window"
- ✅ Avoid high-risk correction cycles
- ✅ Backtested data from the last 20+ years