May 19, 2026 a 06:44 am
PAYX: Fibonacci Analysis - Paychex, Inc.
Paychex, Inc., providing comprehensive human capital management solutions, demonstrates potential stability in stock performance due to its diversified service offerings across payroll and HR management sectors. Recent data analysis indicates a transition from a prolonged downtrend to a stabilization phase, opening avenues for potential gains. Technical indicators suggest close monitoring for entry points as market conditions evolve.
Fibonacci Analysis
Trend Overview and Fibonacci Levels
| Analysis | Details |
|---|---|
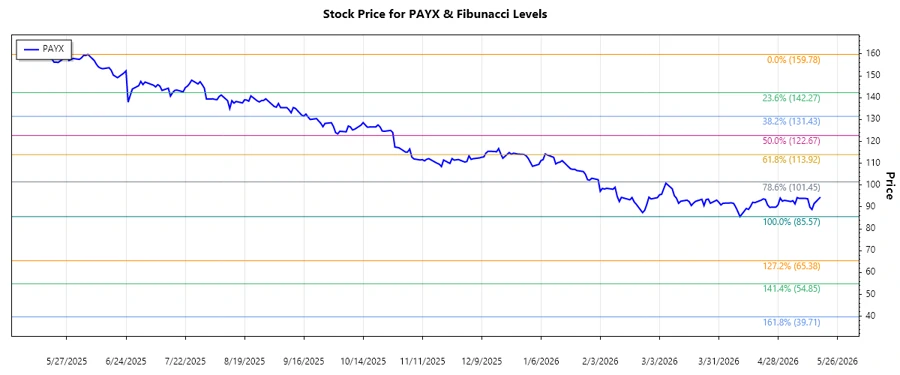
| Trend Start Date | 2025-08-22 |
| Trend End Date | 2026-05-18 |
| High Price and Date | 159.78 on 2025-06-06 |
| Low Price and Date | 85.57 on 2026-04-10 |
| Fibonacci Retracement Levels |
|
| Current Price | 94.49 |
| Retracement Zone | None |
| Technical Interpretation | The current price is below the 0.236 retracement level, indicating continued resistance at higher levels. Investors might consider watching for potential support at the next key levels. |
Conclusion
Paychex, Inc., showing recovery signs from its lowest price within this period, presents potential technical opportunities. The data-driven Fibonacci retracement analysis suggests a possible hold for further insights as it lingers below the primary retracement levels. The company's broad spectrum of services provides added stability amid uncertain markets. However, investors should remain vigilant of broader market indicators influencing the stock's trajectory. Understanding these technical signals can be essential for strategizing future investments in this sector. Continual monitoring and strategic planning are advocated for investors considering entry or adjustment of their positions in PAYX.
Smart Data Insight
Master the Perfect Entry & Exit for this Stock
Don't leave your profits to chance. Historically, this stock follows specific seasonal patterns that institutional traders use to maximize returns.
- ✅ Identify the "Golden Buying Window"
- ✅ Avoid high-risk correction cycles
- ✅ Backtested data from the last 20+ years