August 22, 2025 a 04:45 pm
PAYX: Fibonacci Analysis - Paychex, Inc.
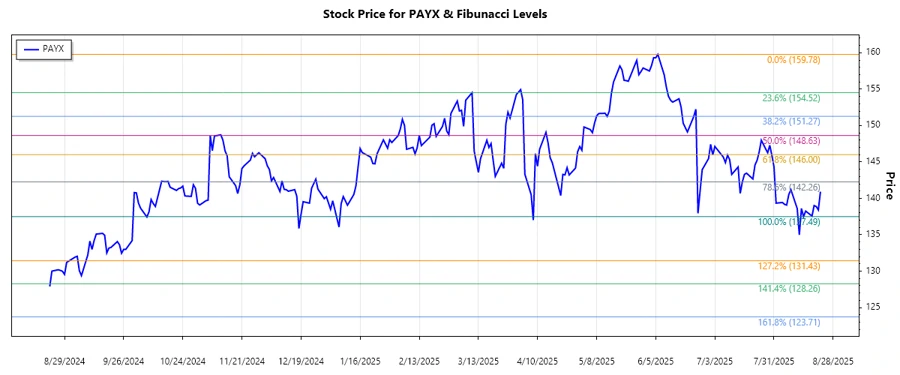
Paychex, Inc. has demonstrated a moderately volatile stock performance over the analyzed period. As a major provider of HR and payroll services, the company is well-positioned in its sector. Given the recent price movements, it is crucial to identify potential retracement levels for future investment decisions.
Fibonacci Analysis
| Analysis Parameter | Details |
|---|---|
| Start Date | 2025-06-06 |
| End Date | 2025-08-22 |
| High Point | $159.78 on 2025-06-06 |
| Low Point | $137.49 on 2025-08-14 |
| Fibonacci Level | Price Level |
|---|---|
| 0.236 | $143.97 |
| 0.382 | $147.33 |
| 0.5 | $148.64 |
| 0.618 | $149.95 |
| 0.786 | $151.89 |
The current price is within the 0.618 retracement level, indicating potential resistance. If the price consolidates beyond this zone, it could suggest a bullish continuation trend. Investors may look for breakout confirmations for potential entry points.
Conclusion
The Fibonacci retracement analysis for Paychex, Inc. indicates the stock may encounter significant resistance at the 0.618 level. Investors should monitor for breakout signals as a move above could present bullish opportunities. Conversely, a failure to sustain above this level might lead to retests of lower retracement zones. With steady demand for HR and payroll services, Paychex remains fundamentally strong, though market conditions may affect short-term volatility.
Smart Data Insight
Master the Perfect Entry & Exit for this Stock
Don't leave your profits to chance. Historically, this stock follows specific seasonal patterns that institutional traders use to maximize returns.
- ✅ Identify the "Golden Buying Window"
- ✅ Avoid high-risk correction cycles
- ✅ Backtested data from the last 20+ years