August 20, 2025 a 10:15 am
PAYX: Fibunacci Analysis - Paychex, Inc.
Paychex, Inc. currently presents an interesting case for investors, balancing between its robust service offerings and the macroeconomic pressures that could affect small to medium-sized businesses. The recent price movements suggest a strong bearish trend which warrants a detailed Fibonacci analysis to identify potential reversal points. Analysts must consider both the company's solid market presence and the competitive landscape in the HCM solutions market.
Fibunacci Analysis
| Detail | Value |
|---|---|
| Trend Type | Downtrend |
| Start Date | 2024-08-20 |
| End Date | 2025-08-19 |
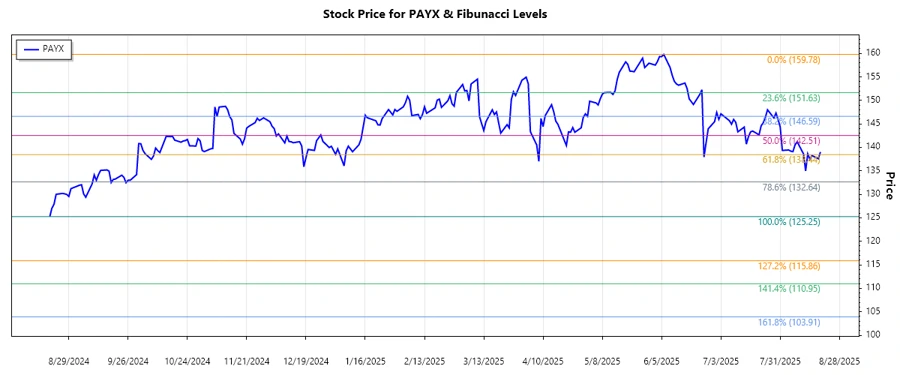
| High Price | 159.78 (2025-06-06) |
| Low Price | 125.25 (2024-08-20) |
| Retracement Level | Price Level |
|---|---|
| 0.236 | 133.11 |
| 0.382 | 139.19 |
| 0.5 | 142.52 |
| 0.618 | 145.85 |
| 0.786 | 150.57 |
The current price of $139.01 is near the 0.382 retracement level, indicating potential resistance. Such levels often serve as a battleground where buyers and sellers test the strength of the previous direction.
Conclusion
The analysis of Paychex's stock price indicates a firm downtrend from its peak in June 2025. While the current price is hovering around a significant Fibonacci resistance level, a breakthrough may suggest further potential downward movement or a correction. The company's strong product offering and market position could buffer against economic downturns, although emerging competitive pressures and macroeconomic uncertainties remain risks. For technical analysts, monitoring price action around the 0.382 level is crucial to anticipate future movements.