
May 28, 2026 a 03:31 am

PAYX: Dividend Analysis - Paychex, Inc.
Paychex, Inc. presents a strong dividend profile supported by consistent payments over 39 years. With a competitive dividend yield of 4.93% and a recent history of maintained distributions, it positions itself as a reliable player in the market. Stable payout ratios backed by robust financial health further bolster confidence in Paychex's commitment to shareholder returns.
📊 Overview
Paychex, Inc. operates in a sector that traditionally values consistent cash flows and steady income generation. Its current dividend yield stands at 4.93%, supported by a $4.02 USD dividend per share, reflecting the company's strong and stable dividend history over 39 years.
| Attribute | Value |
|---|---|
| Sector | Business Services |
| Dividend Yield | 4.93% |
| Current Dividend Per Share | $4.02 |
| Dividend History | 39 years |
| Last Cut or Suspension | None |
📈 Dividend History
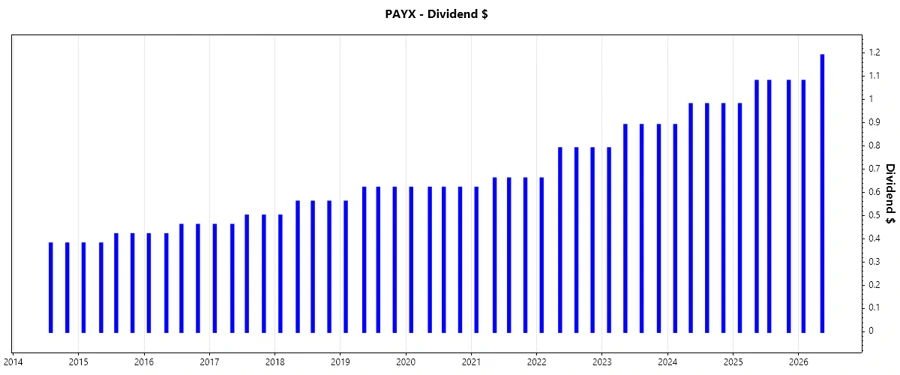
Evaluating Paychex's dividend history is crucial as it demonstrates the company's ability to generate and distribute profits consistently. A well-documented history often mirrors operational efficiency and financial stability.
| Year | Dividend Per Share (USD) |
|---|---|
| 2026 | $2.27 |
| 2025 | $4.22 |
| 2024 | $3.83 |
| 2023 | $3.46 |
| 2022 | $3.03 |
📊 Dividend Growth
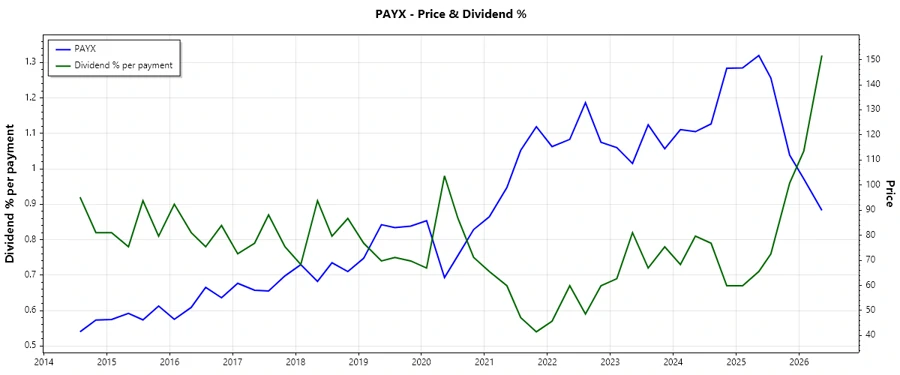
Analyzing Paychex's dividend growth rates over different periods provides insights into its growth strategy and financial health. Dividend growth of 11.17% over the last 5 years indicates a moderate but steady increase, suggesting strong future income stability for investors.
| Time | Growth |
|---|---|
| 3 years | 11.68% |
| 5 years | 11.17% |
The average dividend growth is 11.17% over 5 years. This shows moderate but steady dividend growth.
🗣️ Payout Ratio
The payout ratio is an essential measure, evaluating the proportion of earnings paid to shareholders. An EPS-based payout ratio of 88.30% and an FCF-based ratio of 66.96% suggest a high payout strategy, indicating substantial distributions to shareholders but potentially limited reinvestment into operations.
| Key figure | Ratio |
|---|---|
| EPS-based | 88.30% |
| Free cash flow-based | 66.96% |
These payout ratios reflect a commitment to return excess cash to shareholders while balancing reinvestment needs, but they are approaching levels that suggest a cautious outlook on future growth capabilities.
🔄 Cashflow & Capital Efficiency
Effective cash flow management and capital efficiency are vital indicators of operational success and sustainable growth. Paychex's free cash flow yield and earnings yield moderately support capital reinvestment while maintaining shareholder payouts.
| Year | 2023 | 2024 | 2025 |
|---|---|---|---|
| Free Cash Flow Yield | 6.36% | 4.01% | 3.09% |
| Earnings Yield | 4.82% | 3.90% | 2.91% |
| CAPEX / Operating Cash Flow | 9.64% | 8.50% | 9.83% |
| Stock-based Compensation to Revenue | 1.19% | 1.16% | 2.01% |
| Free Cash Flow / Operating Cash Flow | 90.17% | 91.49% | 90.16% |
The analysis confirms Paychex, Inc.'s capability to manage cash efficiently, ensuring that operational expenses and strategic investments do not compromise cash returns to shareholders.
📉 Balance Sheet & Leverage Analysis
Analyzing balance sheet ratios offers insights into financial stability and the company's ability to meet its obligations. A moderate debt-to-equity ratio and strong coverage ratios reflect robust financial health.
| Metric | 2023 | 2024 | 2025 |
|---|---|---|---|
| Debt-to-Equity | 24.78% | 22.79% | 121.66% |
| Debt-to-Assets | 8.21% | 8.34% | 30.32% |
| Debt-to-Capital | 19.86% | 18.56% | 54.89% |
| Net Debt to EBITDA | -16.12% | -24.78% | 136.25% |
| Current Ratio | 1.30 | 1.37 | 1.28 |
| Quick Ratio | 1.30 | 1.37 | 1.28 |
| Financial Leverage | 3.02 | 2.73 | 4.01 |
The company's balance sheet shows resilience with healthy liquidity metrics and manageable leverage, suggesting its capacity to weather economic challenges effectively.
🔍 Fundamental Strength & Profitability
Paychex, Inc. demonstrates strong fundamental performance metrics, particularly in profitability with high return on equity and asset returns that indicate efficient use of capital to generate profits.
| Metric | 2023 | 2024 | 2025 |
|---|---|---|---|
| Return on Equity | 44.58% | 44.47% | 40.15% |
| Return on Assets | 14.77% | 16.28% | 10.01% |
| Margins: Net | 31.10% | 32.03% | 29.74% |
| Margins: EBIT | 40.60% | 42.73% | 40.94% |
| Margins: EBITDA | 44.13% | 46.07% | 44.70% |
| Margins: Gross | 70.98% | 71.97% | 72.35% |
| Research & Development to Revenue | 0% | 0% | 0% |
Paychex, Inc. exhibits strong profitability, leveraging its resources to produce excellent financial outputs, underscoring its competitive positioning within the industry.
📈 Price Development
✅ Dividend Scoring System
Paychex, Inc.'s dividend scoring highlights its comprehensive strength across multiple domains. The scoring reflects continued reliability combined with sustained financial fortitude.
| Criteria | Score | Visualization |
|---|---|---|
| Dividend Yield | 4 | |
| Dividend Stability | 5 | |
| Dividend Growth | 3 | |
| Payout Ratio | 3 | |
| Financial Stability | 4 | |
| Dividend Continuity | 5 | |
| Cashflow Coverage | 4 | |
| Balance Sheet Quality | 4 |
Total Score: 32/40
🌟 Rating
Overall, Paychex, Inc. offers a compelling dividend proposition characterized by its robust payout history, financial strength, and strategic growth plans. The total dividend score of 32 out of 40 underscores its dependable nature, making it a solid choice for dividend-focused investors looking for consistent returns with assured stability.
Smart Data Insight
Master the Perfect Entry & Exit for this Stock
Don't leave your profits to chance. Historically, this stock follows specific seasonal patterns that institutional traders use to maximize returns.
- ✅ Identify the "Golden Buying Window"
- ✅ Avoid high-risk correction cycles
- ✅ Backtested data from the last 20+ years