November 26, 2025 a 07:31 am


PAYX: Dividend Analysis - Paychex, Inc.
Paychex, Inc. presents itself as a stalwart in consistent dividend offerings, with a solid yield and admirable growth trajectory in recent years. Its history of dividends, spanning almost four decades, reflects commitment to shareholder returns. Although payout ratios appear elevated, they still imply a capacity to sustain payouts alongside a strong cash flow generation capability. This positions Paychex as a reliable dividend-paying entity, albeit with a keen eye needed on maintaining cash flow stability.
📊 Overview
Paychex, Inc. operates within the sector of financial and business services, exhibiting a stable dividend yield of 3.77%. With a current dividend per share at $4.02 USD, Paychex boasts an impressive dividend history covering 38 years, with the last cut occurring back in 2013.
| Category | Details |
|---|---|
| Sector | Financial and Business Services |
| Dividend Yield | 3.77 % |
| Current Dividend per Share | $4.02 USD |
| Dividend History | 38 years |
| Last Cut or Suspension | 2013 |
🗣️ Dividend History
Paychex has maintained a robust dividend history, reflecting consistent enhancements in shareholder value over nearly four decades. This track record is of paramount importance to income-focused investors who prioritize dividend reliability and supplementation of cash flows.
| Year | Dividend per Share (USD) |
|---|---|
| 2025 | 4.22 |
| 2024 | 3.83 |
| 2023 | 3.46 |
| 2022 | 3.03 |
| 2021 | 2.60 |
📈 Dividend Growth
The dividend growth metrics underscore Paychex's strategy of steady increases, with a 13.78% growth over 3 years and 9.62% over 5 years. These percentages illustrate a consistent upwards trajectory, resonating well with long-term growth investors.
| Time Frame | Growth |
|---|---|
| 3 years | 13.78 % |
| 5 years | 9.62 % |
The average dividend growth is 9.62% over 5 years. This shows moderate but steady dividend growth.
✅ Payout Ratio
Analyzing payout ratios, an EPS-based payout of 89.74% and an FCF-based payout of 75.34% suggest Paychex's firm commitment to generous shareholder distributions, yet mark potential limits on future dividend increases unless profitability is enhanced.
| Key Figure | Ratio |
|---|---|
| EPS-based | 89.74 % |
| Free cash flow-based | 75.34 % |
These payout ratios underscore the company's high dividend distribution relative to earnings and free cash flow, warranting vigilance on future earnings performance and cash flow sustainability.
💼 Cashflow & Capital Efficiency
A detailed examination of cash flows and capital efficiency indicators for Paychex provides insights into the underlying sustainability of dividend payouts and the efficient use of capital.
| Year | 2025 | 2024 | 2023 |
|---|---|---|---|
| Free Cash Flow Yield | 3.09 % | 4.01 % | 4.12 % |
| Earnings Yield | 2.91 % | 3.90 % | 4.12 % |
| CAPEX to Operating Cash Flow | 9.83 % | 8.51 % | 8.41 % |
| Stock-based Compensation to Revenue | 2.01 % | 1.16 % | 1.25 % |
| Free Cash Flow / Operating Cash Flow Ratio | 90.17 % | 91.49 % | 91.58 % |
| Return on Invested Capital | 16.77 % | 32.54 % | 32.54 % |
Overall, the metrics reflect considerable cash flow efficiency and sound capital utilization, providing a solid foundation for the sustainability of Paychex's dividend commitments.
📈 Balance Sheet & Leverage Analysis
Paychex's balance sheet and leverage metrics are key in assessing its financial robustness and capacity to uphold its dividend policy amidst external pressures.
| Metric | 2025 | 2024 | 2023 |
|---|---|---|---|
| Debt-to-Equity | 121.66 % | 22.79 % | 24.78 % |
| Debt-to-Assets | 30.32 % | 8.34 % | 8.21 % |
| Debt-to-Capital | 54.89 % | 18.56 % | 19.86 % |
| Net Debt to EBITDA | 1.36 | -0.25 | -0.16 |
| Current Ratio | 1.28 | 1.37 | 1.30 |
| Quick Ratio | 1.28 | 1.37 | 1.30 |
| Financial Leverage | 4.01 | 2.73 | 3.02 |
In summary, Paychex maintains a comfortable leverage position, supporting financial flexibility essential to capital management activities and dividend sustenance.
⚠️ Fundamental Strength & Profitability
Understanding Paychex's profitability through key metrics such as return ratios and margins is critical to gauge its operational effectiveness and potential for sustained shareholder returns.
| Metric | 2025 | 2024 | 2023 |
|---|---|---|---|
| Return on Equity | 40.15 % | 44.47 % | 44.58 % |
| Return on Assets | 10.01 % | 16.28 % | 14.77 % |
| Net Margin | 29.74 % | 32.03 % | 31.10 % |
| EBIT Margin | 40.94 % | 42.73 % | 40.60 % |
| EBITDA Margin | 44.70 % | 46.07 % | 44.13 % |
| Gross Margin | 72.35 % | 71.97 % | 70.98 % |
| Research & Development to Revenue | 0 % | 0 % | 0 % |
The profitability indicators confirm Paychex's prowess in maintaining healthy operational margins and exceptional ROI metrics, which are instrumental in forecasting sustained dividends.
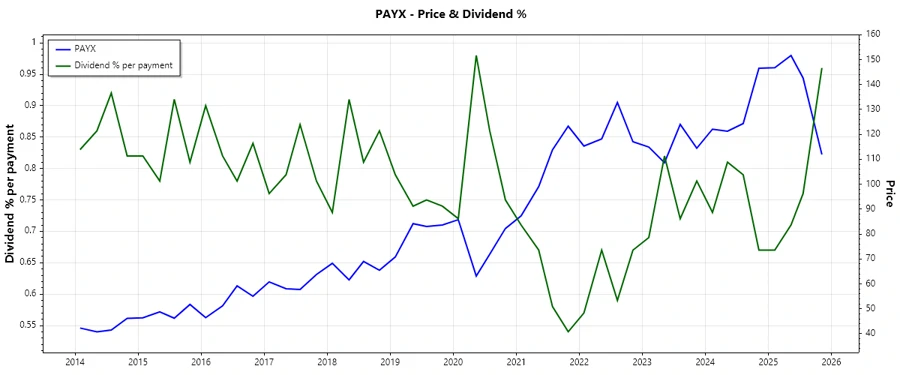
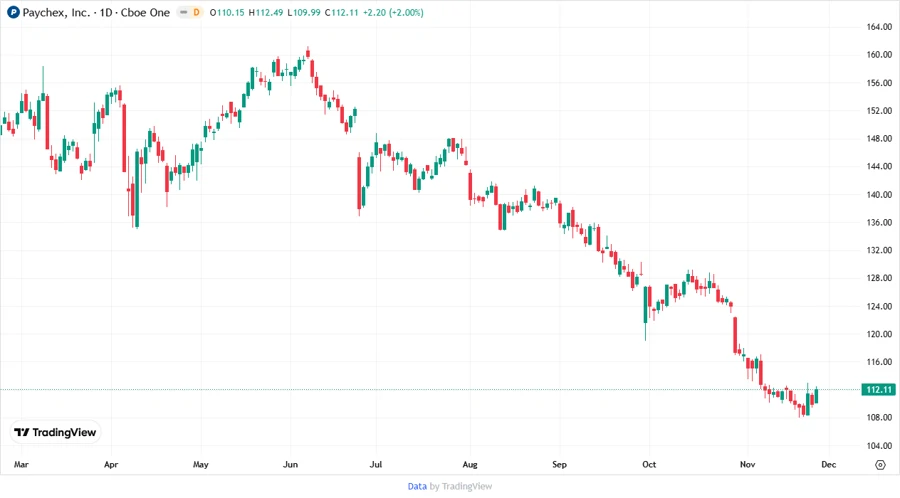
📉 Price Development
Dividend Scoring System
| Criteria | Score | Bar |
|---|---|---|
| Dividend Yield | 4 | |
| Dividend Stability | 5 | |
| Dividend Growth | 4 | |
| Payout Ratio | 3 | |
| Financial Stability | 4 | |
| Dividend Continuity | 5 | |
| Cashflow Coverage | 4 | |
| Balance Sheet Quality | 4 |
Total: 33/40
✅ Rating
In conclusion, Paychex, Inc. exemplifies a robust dividend proposition characterized by its consistent payout history, moderate growth, and financial stability. While some financial ratios imply cautious optimism regarding potential headwinds, the company's strong foundational metrics safeguard its dividend capabilities. Overall, Paychex remains an ideal candidate for conservative investors seeking reliable dividend income, enhanced by robust financial health and operational proficiency.