November 07, 2025 a 07:32 am

PAYX: Dividend Analysis - Paychex, Inc.
Paychex, Inc. is a prominent player in the business services sector, with a strong focus on human resources and payroll management solutions. The company's long-standing tradition of dividend payments is impressive, with over 38 years of consistent distributions, highlighting its reliability as a dividend stock. Paychex's recent financial metrics indicate a robust position with a promising dividend profile. However, with an EPS payout ratio nearing 90%, it's crucial for investors to monitor its sustainability closely.
📊 Overview
Paychex operates in the business services sector, providing HR, payroll, and benefits outsourcing solutions. Its current dividend yield stands at 3.74%, which is attractive for income-seeking investors. The company's dividend per share is $4.02, with a remarkable dividend history spanning 38 years. The last dividend cut or suspension occurred in 2013, which signifies caution in their dividend policy without being overly conservative.
| Metric | Detail |
|---|---|
| Sector | Business Services |
| Dividend yield | 3.74 % |
| Current dividend per share | 4.02 USD |
| Dividend history | 38 years |
| Last cut or suspension | 2013 |
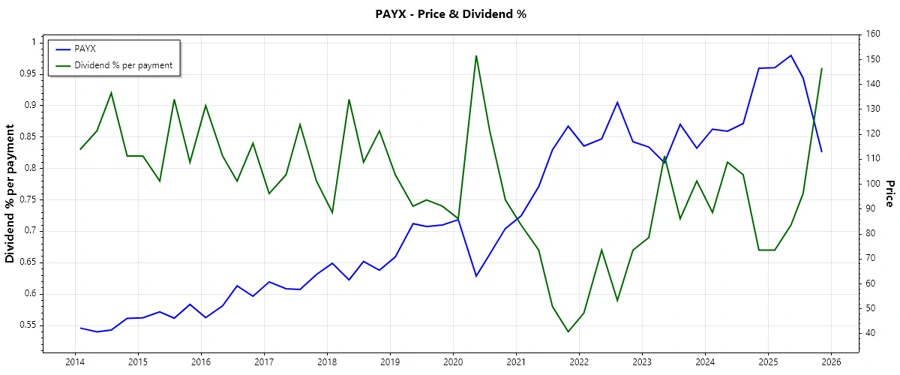
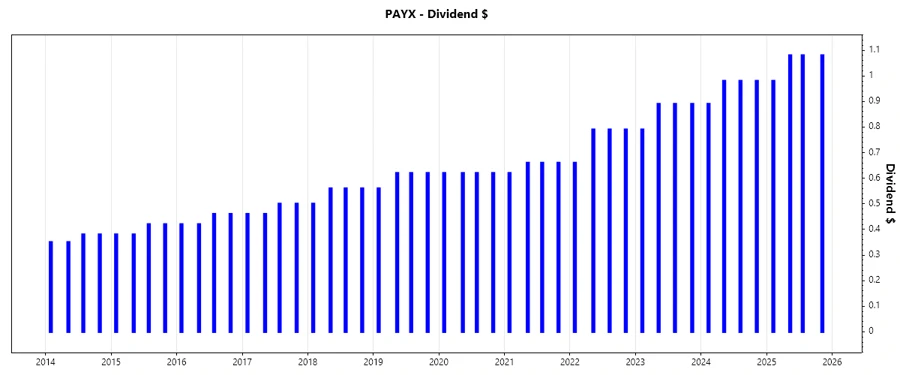
📉 Dividend History
The consistent dividend payments by Paychex illustrate the company's commitment to returning value to shareholders. This reinforces investor confidence and can positively impact share price stability. Consistent dividends are often a sign of sound financial health and operational stability.
| Year | Dividend Per Share (USD) |
|---|---|
| 2025 | 4.22 |
| 2024 | 3.83 |
| 2023 | 3.46 |
| 2022 | 3.03 |
| 2021 | 2.60 |
📈 Dividend Growth
Dividend growth is crucial for income stability against inflation. Paychex has displayed a modest dividend growth rate of 13.78% over the last three years and 9.62% over the past five years. These statistics imply the company's capability to enhance shareholder value gradually.
| Time | Growth |
|---|---|
| 3 years | 13.78 % |
| 5 years | 9.62 % |
The average dividend growth is 9.62 % over 5 years. This shows moderate but steady dividend growth.
🗣️ Payout Ratio
The payout ratio is a vital metric for assessing dividend sustainability. Paychex's EPS-based payout ratio of 89.74% suggests most earnings are distributed to shareholders, signaling potential constraints in reinvestment for growth. The FCF-based payout ratio of 75.34% is more conservative, indicating a more sustainable dividend payout level relying on cash flow rather than accounting profits.
| Key Figure | Ratio |
|---|---|
| EPS-based | 89.74 % |
| Free cash flow-based | 75.34 % |
💰 Cashflow & Capital Efficiency
Cash flow metrics are indicative of a company's capacity to sustain dividends and invest in growth. Paychex's operating and free cash flow figures show a robust financial health with sufficient liquidity to cover dividends and capital expenditures.
| Year | 2023 | 2024 | 2025 |
|---|---|---|---|
| Free Cash Flow Yield | 4.12% | 4.01% | 3.09% |
| Earnings Yield | 4.12% | 3.90% | 2.91% |
| CAPEX to Operating Cash Flow | 8.41% | 8.50% | 9.83% |
| Stock-based Compensation to Revenue | 1.25% | 1.16% | 2.01% |
| Free Cash Flow / Operating Cash Flow Ratio | 91.59% | 91.49% | 90.17% |
Overall, Paychex demonstrates stable cash flow health, critical for securing dividend payments and ensuring operational efficiency.
📊 Balance Sheet & Leverage Analysis
Analyzing the balance sheet and leverage ratios provides insights into operational risk. Paychex's manageable debt levels and satisfactory liquidity indicate financial stability, essential for sustaining dividends in challenging periods.
| Year | 2023 | 2024 | 2025 |
|---|---|---|---|
| Debt-to-Equity | 24.78% | 22.79% | 121.66% |
| Debt-to-Assets | 8.21% | 8.34% | 30.32% |
| Debt-to-Capital | 19.86% | 18.56% | 54.89% |
| Net Debt to EBITDA | -0.16 | -0.24 | 1.36 |
| Current Ratio | 1.29 | 1.37 | 1.28 |
| Quick Ratio | 1.30 | 1.37 | 1.28 |
| Financial Leverage | 3.02 | 2.73 | 4.01 |
In terms of leverage, Paychex shows prudent financial management with debt ratios that favor operational stability and provide a buffer in economic downturns.
📊 Fundamental Strength & Profitability
Strong fundamentals and profitability margins are crucial in assessing potential dividend growth. For Paychex, substantial returns on equity and assets reinforce investor confidence, while healthy profit margins underline operational efficiency.
| Year | 2023 | 2024 | 2025 |
|---|---|---|---|
| Return on Equity | 44.58% | 44.47% | 40.15% |
| Return on Assets | 14.77% | 16.28% | 10.01% |
| Margins: Net | 31.10% | 32.03% | 29.74% |
| EBITDA Margin | 44.13% | 46.07% | 44.70% |
| Gross Margin | 70.98% | 71.97% | 72.35% |
Paychex exhibits superior profitability margins and efficiency metrics, supporting continuous dividend payments and indicating strong internal financial management.
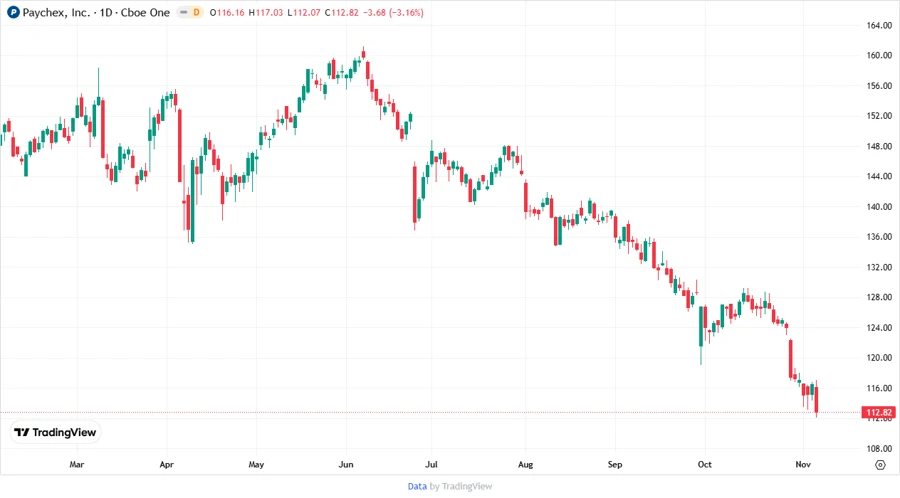
📈 Price Development
💡 Dividend Scoring System
| Criteria | Description | Score |
|---|---|---|
| Dividend yield | Attractive yield of 3.74% | 3 |
| Dividend Stability | 38 years of steady payments | 5 |
| Dividend growth | Stable growth over 5 years | 4 |
| Payout ratio | High EPS payout ratio | 3 |
| Financial stability | Prudent debt management | 4 |
| Dividend continuity | Last cut in 2013 | 4 |
| Cashflow Coverage | Strong cash flow backing | 4 |
| Balance Sheet Quality | Solid leverage and liquidity | 4 |
Overall Score: 31/40
✅ Rating
Paychex, Inc. offers a well-rounded dividend profile with strong historical payouts and sustainable financials. While the EPS-based payout ratio is relatively high, the company's solid financial management and cash flow strength underpin its dividend sustainability. Given its market position and operational proficiency, Paychex, Inc. is a commendable choice for dividend investors seeking a balance of yield and growth potential.
Smart Data Insight
Master the Perfect Entry & Exit for this Stock
Don't leave your profits to chance. Historically, this stock follows specific seasonal patterns that institutional traders use to maximize returns.
- ✅ Identify the "Golden Buying Window"
- ✅ Avoid high-risk correction cycles
- ✅ Backtested data from the last 20+ years