August 10, 2025 a 10:15 am
PAYC: Fibonacci Analysis - Paycom Software, Inc.
Paycom Software, Inc., known for providing cloud-based human capital management solutions, has experienced a complex market environment with variations in stock prices reflecting broader economic conditions. The company's robust product suite and innovative offerings make its stock a potential interest for investors focusing on technological advancements in HR solutions. Analysts closely monitoring its stock performance need to weigh both the market dynamics and the technological edge Paycom holds in its sector.
Fibonacci Analysis
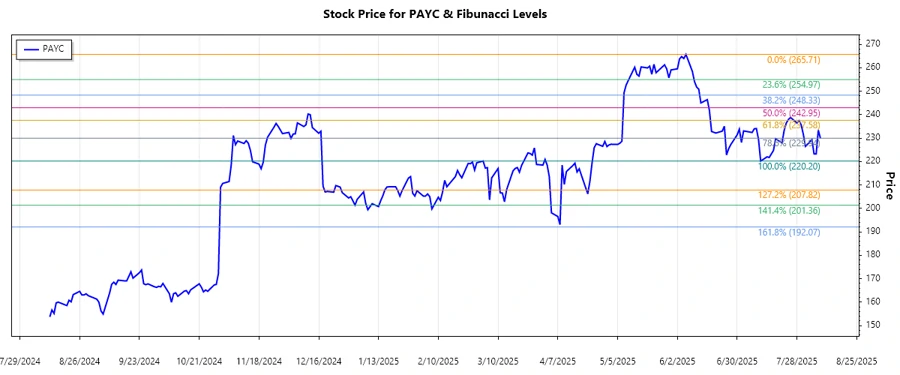
Analyzing Paycom Software's recent stock performance reveals a dominant downward trend starting from June 2025 to August 2025. By identifying the high point at $265.71 on June 6, 2025, and the low point at $220.2 on July 11, 2025, we can calculate the following Fibonacci retracement levels.
| Metric | Details |
|---|---|
| Trend Start Date | 2025-06-06 |
| Trend End Date | 2025-08-08 |
| High Point | $265.71 on 2025-06-06 |
| Low Point | $220.20 on 2025-07-11 |
| Fibonacci 0.236 | $234.76 |
| Fibonacci 0.382 | $243.04 |
| Fibonacci 0.5 | $252.96 |
| Fibonacci 0.618 | $262.89 |
| Fibonacci 0.786 | $272.82 |
| Current Status | The current price of $229.85 is within the 0.236 retracement level, indicating potential support levels. |
This technical analysis suggests that the stock is testing its first significant support level, which could serve as a potential pivot for future upward movement if market conditions improve. Observers should monitor these levels for possible resistance or support confirmations.
Conclusion
Paycom Software, Inc.'s recent stock trends highlight a crucial retracement phase with potential implications for investment strategies. Fibonacci retracement suggests levels where the price might experience support or resistance, offering insights for potential entry or exit points for traders. The presence within the 0.236 retracement level suggests a critical decision point for the stock, potentially indicating a reversal or continuation of the current trend. For analysts, the responsive nature of these levels to market dynamics accentuates the importance of aligning technical evaluations with broader market contexts to optimize potential gains and manage risks effectively.
Smart Data Insight
Master the Perfect Entry & Exit for this Stock
Don't leave your profits to chance. Historically, this stock follows specific seasonal patterns that institutional traders use to maximize returns.
- ✅ Identify the "Golden Buying Window"
- ✅ Avoid high-risk correction cycles
- ✅ Backtested data from the last 20+ years