
July 01, 2026 a 02:03 pm
PARA: Trend and Support & Resistance Analysis - Paramount Global
Paramount Global, a leader in media and entertainment, is currently experiencing notable fluctuations in its stock price. The analysis below aims to explore the current price trends and identify crucial support and resistance levels, providing insights for potential investment decisions.
Trend Analysis
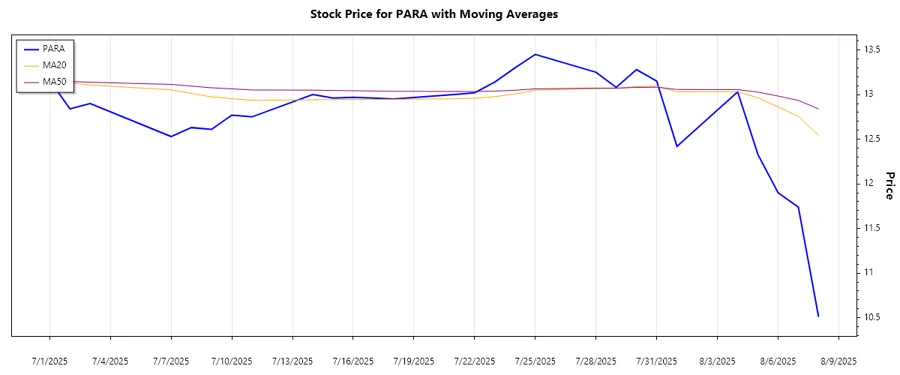
Recent trading data indicates varying short-term movements in Paramount Global's stock price. The calculated EMAs over the given period suggest the stock is currently experiencing a significant trend change. Based on the calculated daily EMAs, the following table outlines the stock's recent direction:
| Date | Closing Price ($) | Trend |
|---|---|---|
| 2025-08-08 | 10.51 | ▼ |
| 2025-08-07 | 11.74 | ▼ |
| 2025-08-06 | 11.90 | ▼ |
| 2025-08-05 | 12.33 | ▼ |
| 2025-08-04 | 13.03 | ▼ |
| 2025-08-01 | 12.42 | ▼ |
| 2025-07-31 | 13.15 | ▼ |
Over the observed period, the trend appears to depict a consistent decline, suggesting a strong ▼ downtrend. Analysts should consider this trend indication in their future predictions and investment decisions for Paramount Global.
Support and Resistance
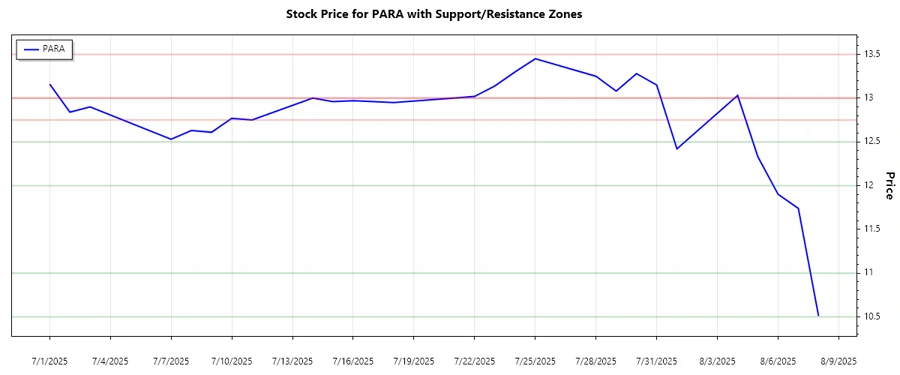
The analysis has identified two prevalent support and resistance zones for Paramount Global's stock based on historical price points:
| Zone Type | From ($) | To ($) | Direction |
|---|---|---|---|
| Support | 10.50 | 11.00 | ▼ |
| Support | 12.00 | 12.50 | ▼ |
| Resistance | 13.00 | 13.50 | ▲ |
| Resistance | 12.75 | 13.00 | ▲ |
Currently, the stock remains between the lower support zone (10.50 to 11.00 USD), indicating potential bearish sentiment. In trading terms, more caution is advised due to these test-level supports.
Conclusion
The technical analysis of Paramount Global's stock suggests a pronounced downward momentum with clear support and resistance markers. Given its presence in lower support zones, the stock illustrates potential risk. However, looking forward, any reversal or breaches beyond resistance levels could signal revised investor sentiment. For analysts, these interpretations provide potential indicators of impending market shifts and possible strategic maneuvers.
Smart Data Insight
Master the Perfect Entry & Exit for this Stock
Don't leave your profits to chance. Historically, this stock follows specific seasonal patterns that institutional traders use to maximize returns.
- ✅ Identify the "Golden Buying Window"
- ✅ Avoid high-risk correction cycles
- ✅ Backtested data from the last 20+ years