June 26, 2026 a 06:44 am
PARA: Fibonacci Analysis - Paramount Global
Paramount Global, a leading entity in the media and entertainment industry, has seen fluctuating stock performance over recent months. Despite some volatility, the stock remains a significant player in the market due to its extensive media portfolio. Investors are keenly watching its stock movements, especially given the dynamic landscape of streaming services and traditional media.
Fibonacci Analysis
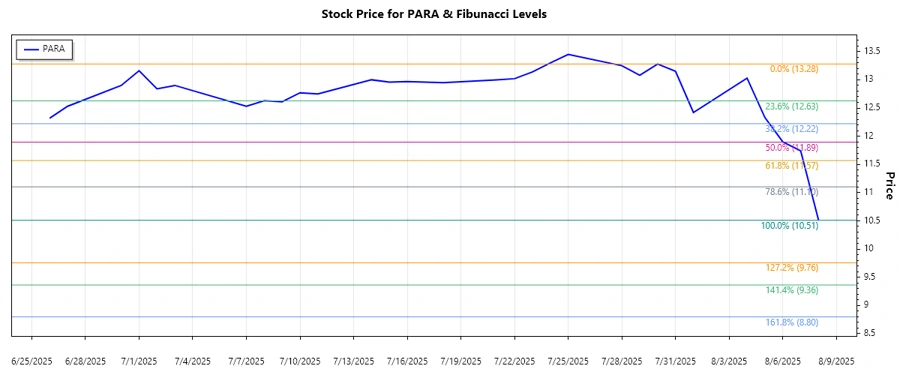
The analyzed trend spans from June 26, 2025, to August 8, 2025, showcasing a dominant downtrend. The stock peaked at $13.28 on July 30, 2025, and reached a low of $10.51 on August 8, 2025. Below are the calculated Fibonacci retracement levels:
| Level | Price |
|---|---|
| 0.236 | $11.32 |
| 0.382 | $11.85 |
| 0.5 | $12.39 |
| 0.618 | $12.92 |
| 0.786 | $13.23 |
Currently, the stock price is at $10.51, below all Fibonacci retracement levels, indicating it is not in a retracement zone. Technically, this suggests potential further downside or a strong support level forming.
Conclusion
Paramount Global's current stock performance highlights both challenges and opportunities in the rapidly evolving media sector. While the downtrend is evident, analysts suggest keeping an eye on potential support levels that might signify a shift or reversal in trend. The company’s strong portfolio could be a stabilizing factor, and investors should watch for market reactions to upcoming media releases and financial reports to better gauge future movements.
Smart Data Insight
Master the Perfect Entry & Exit for this Stock
Don't leave your profits to chance. Historically, this stock follows specific seasonal patterns that institutional traders use to maximize returns.
- ✅ Identify the "Golden Buying Window"
- ✅ Avoid high-risk correction cycles
- ✅ Backtested data from the last 20+ years