March 21, 2026 a 10:15 am

PARA: Fibunacci Analysis - Paramount Global
Paramount Global, ticker PARA, is a major player in the media and entertainment industry. Notably, it has shown resilience through various market conditions, though recent trends suggest volatility. Investors should closely monitor the stock's technical indicators to anticipate possible market movements. The following detailed Fibonacci analysis aims to offer insights into the stock's current performance and potential price action levels.
Fibonacci Analysis
| Detail | Information |
|---|---|
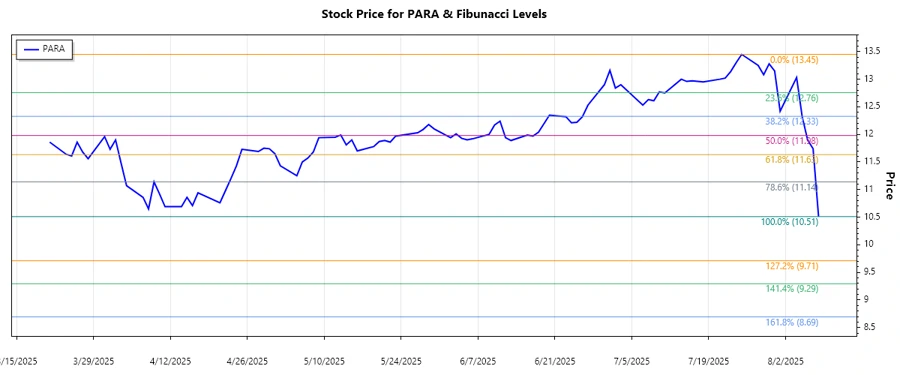
| Analyzed Trend Start Date | 2025-04-21 |
| Analyzed Trend End Date | 2025-08-08 |
| High Price | $13.45 on 2025-07-25 |
| Low Price | $10.51 on 2025-08-08 |
| Current Price | $10.51 |
| Fibonacci 0.236 Level | $11.18 |
| Fibonacci 0.382 Level | $11.55 |
| Fibonacci 0.5 Level | $11.98 |
| Fibonacci 0.618 Level | $12.41 |
| Fibonacci 0.786 Level | $12.92 |
| Retracement Zone | None (close to new low) |
The current price of $10.51 suggests it is near a potential support level and has not yet entered any Fibonacci Retracement Zone. Technically, this could be seen as a continuation of the downtrend unless a reversal signal emerges. Investors should remain cautious until a definitive signal of trend reversal is confirmed.
Conclusion
Paramount Global's current price position near its recent low indicates uncertainty within its market environment. Such a position could denote an impending further decrease unless significant fundamental or technical drivers emerge. The absence within the Fibonacci retracement levels underscores potential volatility. Analysts should closely follow any breakout signals or stronger price action to redefine potential entry points or trend stabilizations. Investors may consider waiting for stronger confirmation of reversal or support before making decisions.