
March 16, 2026 a 12:46 pm

PARA: Dividend Analysis - Paramount Global
Paramount Global, amidst fluctuating financial indicators, maintains a moderate dividend yield. Despite some historical cuts, it remains a notable player with over two decades of dividend history.
📊 Overview
Paramount Global, operating in the diverse media sector, holds a substantial market stance with a dividend yield below 2%. Consistent dividend payments over 21 years reflect resilience, albeit facing recent payout adjustments.
| Key Metrics | Details |
|---|---|
| Sector | Media |
| Dividend yield | 1.90 % |
| Current dividend per share | 0.17 USD |
| Dividend history | 21 years |
| Last cut or suspension | None |
🏛️ Dividend History
Analyzing the dividend history highlights Paramount Global's sustained efforts in rewarding shareholders, crucial for investor confidence. Examination of distribution consistency indicates the firm's dedication to maintaining payouts despite economic pressures.
| Year | Dividend Payment (USD) |
|---|---|
| 2026 | 0.05 |
| 2025 | 0.20 |
| 2024 | 0.20 |
| 2023 | 0.39 |
| 2022 | 0.96 |
📈 Dividend Growth
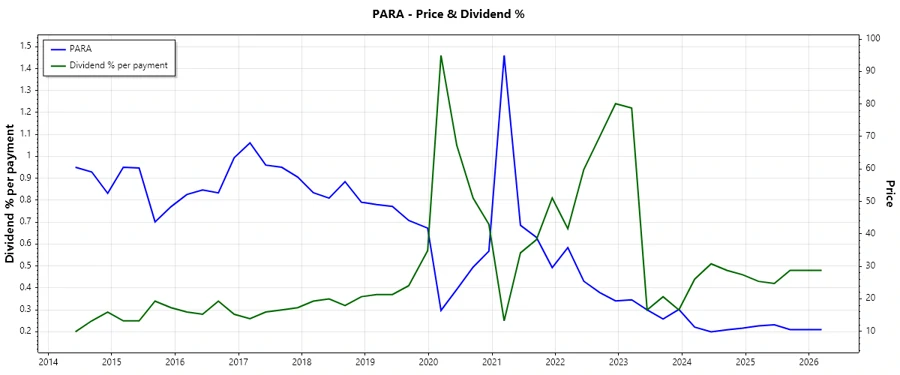
Dividend growth analysis offers insights into future payout potential. Paramount Global shows a negative dividend growth over recent years, reflecting strategic restructuring or market challenges.
| Time | Growth |
|---|---|
| 3 years | -0.41 % |
| 5 years | -0.27 % |
The average dividend growth is -0.27 % over 5 years. This shows a decline, suggesting careful review of future dividend sustainability policies.
📉 Payout Ratio
Payout ratio illustrates the portion of earnings and cash flow paid as dividends. A negative EPS-based payout ratio implies Paramount Global is paying dividends out of reserves or has incurred losses, indicating potential sustainability concerns.
| Key figure | Ratio |
|---|---|
| EPS-based | -17.97 % |
| Free cash flow-based | 22.33 % |
The negative EPS payout ratio contrasts with a positive FCF ratio, showing reliance on cash reserves rather than earnings—a crucial indicator of stressed financial leveraging.
🔍 Cashflow & Capital Efficiency
Efficient cashflow and capital management are pivotal for operational vitality. Paramount Global's cashflow metrics reveal challenges, with income quality indicators necessitating scrutiny for sustainable cash generation.
| Metric | 2025 | 2024 | 2023 |
|---|---|---|---|
| Free Cash Flow Yield | 0.0303 | 0.0704 | 0.0157 |
| Earnings Yield | -0.0533 | -0.8912 | -0.0648 |
| CAPEX to Operating Cash Flow | 0.4561 | 0.3497 | 0.6905 |
| Stock-based Compensation to Revenue | 0.0083 | 0.0083 | 0.0060 |
| Free Cash Flow / Operating Cash Flow Ratio | 0.5439 | 0.6503 | 0.3095 |
| Return on Invested Capital | 0.0347 | -0.1374 | -0.0073 |
Despite some positive cash flow yields, overall capital efficiency suggests need for strategic fiscal enhancements to bolster return on capital invested.
🏢 Balance Sheet & Leverage Analysis
Paramount Global's leverage ratios provide insight into financial stability, with significant debt ratios indicating elevated leverage. Monitoring these ratios is essential to assess debt servicing capacity and liquidity management.
| Metric | 2025 | 2024 | 2023 |
|---|---|---|---|
| Debt-to-Equity | 1.3890 | 0.9528 | 0.7040 |
| Debt-to-Assets | 0.3747 | 0.3368 | 0.2962 |
| Debt-to-Capital | 0.5814 | 0.4879 | 0.4131 |
| Net Debt to EBITDA | 4.2728 | -2.6169 | 157.6235 |
| Current Ratio | 1.2567 | 1.3023 | 1.3156 |
| Quick Ratio | 1.1189 | 1.1539 | 1.1691 |
| Financial Leverage | 3.7067 | 2.8292 | 2.3769 |
Higher leverage indicates a reliance on borrowing, implying both potential growth leverage and elevated risk. Strategic debt management is essential for sustaining financial health.
📑 Fundamental Strength & Profitability
Profitability indices provide vital clues to operational efficiency and competitive edge. The weak returns seen in Paramount Global suggest operational inefficiencies, calling for strategic realignments.
| Metric | 2025 | 2024 | 2023 |
|---|---|---|---|
| Return on Equity | -0.0531 | -0.3793 | -0.0270 |
| Return on Assets | -0.0143 | -0.1341 | -0.0114 |
| Margins: Net | -0.0215 | -0.2119 | -0.0205 |
| Margins: EBIT | 0.0776 | -0.1820 | -0.0112 |
| Margins: EBITDA | 0.1051 | -0.1686 | 0.0029 |
| Margins: Gross | 0.2894 | 0.2964 | 0.2450 |
| Research & Development to Revenue | 0 | 0 | 0 |
The negative profitability metrics echo operational inefficiencies, indicating need for a realignment towards value-enhancing operations.
📅 Price Development
🗣️ Dividend Scoring System
| Criteria | Description | Score |
|---|---|---|
| Dividend yield | Current return from dividends | |
| Dividend Stability | Consistency over time | |
| Dividend growth | Increasing payouts | |
| Payout ratio | Earnings against dividends | |
| Financial stability | Solid financial grounds | |
| Dividend continuity | Without disruption | |
| Cashflow Coverage | Dividends vs Cash Flow | |
| Balance Sheet Quality | Debt & Equity position |
Total Score: 27/40
✅ Rating
Paramount Global's current dividend profile reflects moderate resilience amidst financial challenges. Despite sustained payouts, negative growth and leveraged metrics necessitate a cautious approach. Investors should weigh long-term strategic possibilities against current operational constraints, maintaining a watchful eye on financial adjustments that bolster dividend sustainability.
Smart Data Insight
Master the Perfect Entry & Exit for this Stock
Don't leave your profits to chance. Historically, this stock follows specific seasonal patterns that institutional traders use to maximize returns.
- ✅ Identify the "Golden Buying Window"
- ✅ Avoid high-risk correction cycles
- ✅ Backtested data from the last 20+ years