June 21, 2025 a 07:46 am


PARA: Dividend Analysis - Paramount Global
Paramount Global presents a mixed picture for dividend investors. With a current dividend yield of 1.67% and a long history of 20 years of payments, its offering is marred by recent negative growth rates over the past five years. Despite maintaining payouts, the company's challenging earnings landscape marks a cautious path forward.
📊 Overview
The following table summarizes key dividend-related metrics for Paramount Global, highlighting its sector and payment history.
| Metric | Value |
|---|---|
| Sector | Media |
| Dividend yield | 1.67% |
| Current dividend per share | $0.25 |
| Dividend history | 20 years |
| Last cut or suspension | None |
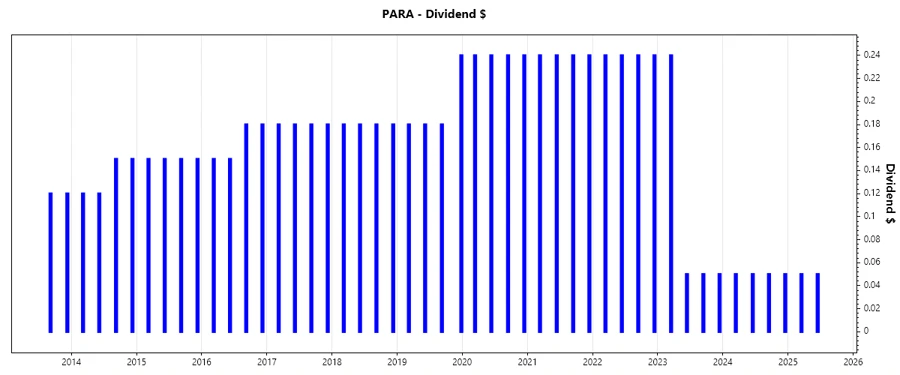
📉 Dividend History
Analyzing Paramount's dividend history offers insight into its ability to maintain payouts even amidst financial adversity. A consistent dividend history is often favorable for income-seeking investors.
| Year | Dividend per Share (USD) |
|---|---|
| 2025 | 0.10 |
| 2024 | 0.20 |
| 2023 | 0.39 |
| 2022 | 0.96 |
| 2021 | 0.96 |
📈 Dividend Growth
The trend in dividend growth often reflects the company's confidence and financial health. Negative growth rates over 3 and 5 years can suggest declining payouts, raising concerns about sustainability.
| Time | Growth |
|---|---|
| 3 years | -40.72% |
| 5 years | -23.83% |
The average dividend growth is -23.83% over 5 years. This shows moderate but steady decline in dividend growth.
✅ Payout Ratio
A high or low payout ratio can indicate potential issues. For Paramount Global, the EPS-based payout ratio is -319.59%, suggesting overpayment beyond earnings, a potential red flag. The FCF-based payout is 44.60%, showing coverage from cash flows.
| Key figure | Ratio |
|---|---|
| EPS-based | -319.59% |
| Free cash flow-based | 44.60% |
💸 Cashflow & Capital Efficiency
Cash flow and capital efficiency metrics such as FCF yield and CAPEX to OCF provide insight into Paramount's operational health and sustainability. These ratios help in understanding cash generation and investment efficiency.
| Year | Free Cash Flow Yield | Earnings Yield | CAPEX to Operating Cash Flow | Stock-based Compensation to Revenue | Free Cash Flow / Operating Cash Flow Ratio | Return on Invested Capital |
|---|---|---|---|---|---|---|
| 2024 | 0.0704 | -0.8912 | 0.3497 | 0.0084 | 0.6503 | -0.1371 |
| 2023 | 0.0157 | -0.0648 | 0.6905 | 0.0060 | 0.3095 | -0.0073 |
| 2022 | -0.0127 | 0.1008 | 1.6347 | 0.0057 | -0.6347 | 0.0405 |
The analysis indicates fluctuating cash flow stability, which could influence future dividend decisions.
💪 Balance Sheet & Leverage Analysis
Paramount's balance sheet ratios, such as Debt-to-Equity and Current Ratio, provide crucial insights into the company's financial robustness and capacity to handle short and long-term obligations.
| Year | Debt-to-Equity | Debt-to-Assets | Debt-to-Capital | Net Debt to EBITDA | Current Ratio | Quick Ratio | Financial Leverage |
|---|---|---|---|---|---|---|---|
| 2024 | 0.953 | 0.337 | 0.488 | -2.617 | 1.302 | 1.154 | 2.829 |
| 2023 | 0.704 | 0.296 | 0.413 | 157.6 | 1.316 | 1.169 | 2.377 |
| 2022 | 0.750 | 0.296 | 0.429 | 5.530 | 1.227 | 1.107 | 2.535 |
The leverage and liquidity analysis raise concerns about financial stability given the high debt levels.
📈 Fundamental Strength & Profitability
These metrics, including ROE and profit margins, are vital for assessing Paramount's ability to generate profit relative to its revenue, assets, and equity.
| Year | Return on Equity | Return on Assets | Net Margin | EBIT Margin | EBITDA Margin | Gross Margin | R&D to Revenue |
|---|---|---|---|---|---|---|---|
| 2024 | -0.379 | -0.134 | -0.2119 | -0.1820 | -0.1686 | 0.3346 | 0 |
| 2023 | -0.027 | -0.011 | -0.0205 | -0.0112 | 0.0029 | 0.2450 | 0 |
| 2022 | 0.048 | 0.019 | 0.0366 | 0.0729 | 0.0863 | 0.3419 | 0 |
The declining ROE and negative margins suggest profitability pressures, impacting overall sustainability.
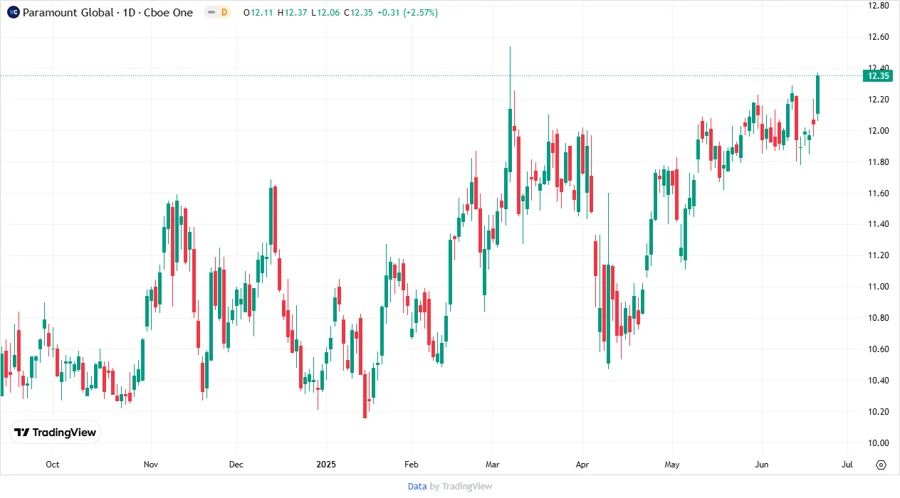
⏫ Price Development
📋 Dividend Scoring System
| Category | Score | Score Bar |
|---|---|---|
| Dividend yield | 2 | |
| Dividend Stability | 3 | |
| Dividend growth | 1 | |
| Payout ratio | 1 | |
| Financial stability | 2 | |
| Dividend continuity | 3 | |
| Cashflow Coverage | 3 | |
| Balance Sheet Quality | 2 |
Overall Score: 17/40
🌟 Rating
Paramount Global's dividend profile shows a company experiencing financial challenges, resulting in a cautious investment outlook. Investors should scrutinize fundamental improvements before considering engagement.
Smart Data Insight
Master the Perfect Entry & Exit for this Stock
Don't leave your profits to chance. Historically, this stock follows specific seasonal patterns that institutional traders use to maximize returns.
- ✅ Identify the "Golden Buying Window"
- ✅ Avoid high-risk correction cycles
- ✅ Backtested data from the last 20+ years