March 03, 2026 a 05:15 am
PANW: Fibonacci Analysis - Palo Alto Networks, Inc.
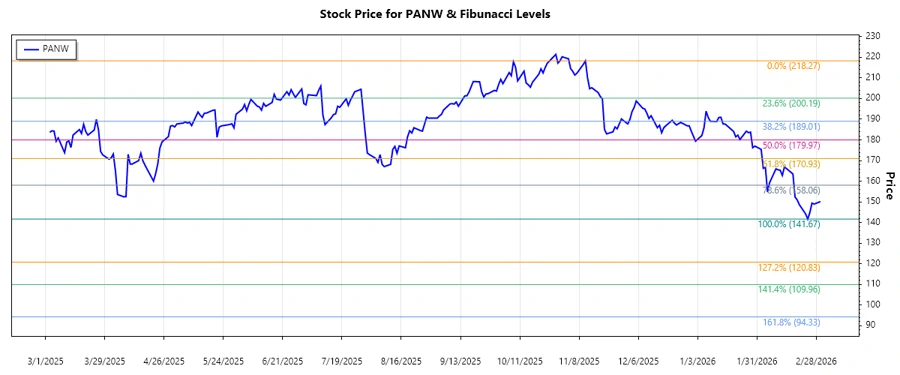
Palo Alto Networks, Inc., a leader in cybersecurity, has shown resilience in a fluctuating market. Over the last months, its stock has experienced notable volatility, primarily influenced by significant industry developments and broader market dynamics. Recent price movements indicate a dominant downtrend, yielding crucial opportunities for Fibonacci retracement analysis. Investors are keenly observing PANW for potential reversal signals or continued downtrend patterns.
Fibonacci Analysis
| Details | Information |
|---|---|
| Trend Start Date | 2025-11-11 |
| Trend End Date | 2026-03-02 |
| High Point | $218.27 on 2025-11-11 |
| Low Point | $141.67 on 2026-02-24 |
| Fibonacci Level | Price Level |
|---|---|
| 0.236 | $159.61 |
| 0.382 | $171.32 |
| 0.5 | $179.97 |
| 0.618 | $188.62 |
| 0.786 | $201.31 |
As of the last data point, the price is $150.15, which is close to the 0.236 Fibonacci retracement level of $159.61. This suggests the potential of a minor bounce, which could lead to a testing of resistance at the 0.236 level. If the price solidifies above this, further resistance levels could be targeted. Conversely, a failure to hold may indicate a deeper continuation of the current downtrend.
Conclusion
Palo Alto Networks, Inc. is navigating through a technical downtrend, with recent analyses indicating potential support at Fibonacci levels. Analysts should be cautious, as the stock is near its lower retracement zones, suggesting limited immediate upside. The calculated levels may serve as benchmarks for support or resistance, providing traders with insights into possible price dynamics. While retracements offer opportunities, risks of further declines remain if new lows are reached. Observing industry trends will be crucial, given PANW's influence in cybersecurity.