November 13, 2025 a 03:15 pm

PANW: Fibonacci Analysis - Palo Alto Networks, Inc.
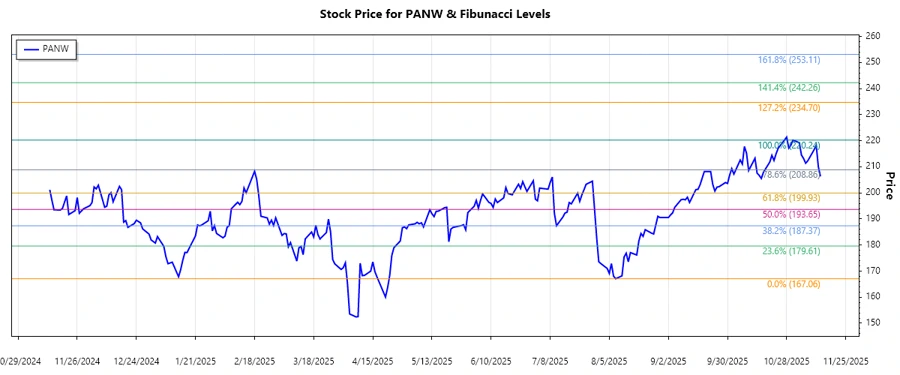
Palo Alto Networks, Inc., a leader in cybersecurity solutions, demonstrates resilience in a competitive market. Recent trends show fluctuations in stock prices, typical for a technology-driven sector. Investors should watch for movements around key support and resistance levels as identified in the technical analysis below.
Fibonacci Analysis
| Detail | Information |
|---|---|
| Start Date | 2025-07-29 |
| End Date | 2025-11-13 |
| High Point | $220.24 on 2025-10-31 |
| Low Point | $167.06 on 2025-08-08 |
| Fibonacci Level | Price |
|---|---|
| 0.236 | $182.67 |
| 0.382 | $191.79 |
| 0.5 | $193.65 |
| 0.618 | $203.42 |
| 0.786 | $212.51 |
The current price of $206.31 indicates that the stock is within the 0.618 Fibonacci retracement level. This suggests potential support around this level. Technically, if the price holds above this level, an upside movement may be anticipated, whereas a fall below could lead to further decline.
Conclusion
The analysis of Palo Alto Networks, Inc. shows an upward trend from August to early November 2025, marked by significant price fluctuations. Currently, the stock is at a crucial Fibonacci retracement level, indicating a potential support area. Investors should consider this level in their trading strategy, as it could hold key insights into future price movements. Nonetheless, the cybersecurity industry's volatility remains a factor, with external market forces potentially impacting stock prices. A strategic approach, taking into account both technical levels and broader market trends, is necessary for making informed investment decisions in Palo Alto Networks.
Smart Data Insight
Master the Perfect Entry & Exit for this Stock
Don't leave your profits to chance. Historically, this stock follows specific seasonal patterns that institutional traders use to maximize returns.
- ✅ Identify the "Golden Buying Window"
- ✅ Avoid high-risk correction cycles
- ✅ Backtested data from the last 20+ years