October 08, 2025 a 10:15 am

PANW: Fibonacci Analysis - Palo Alto Networks, Inc.
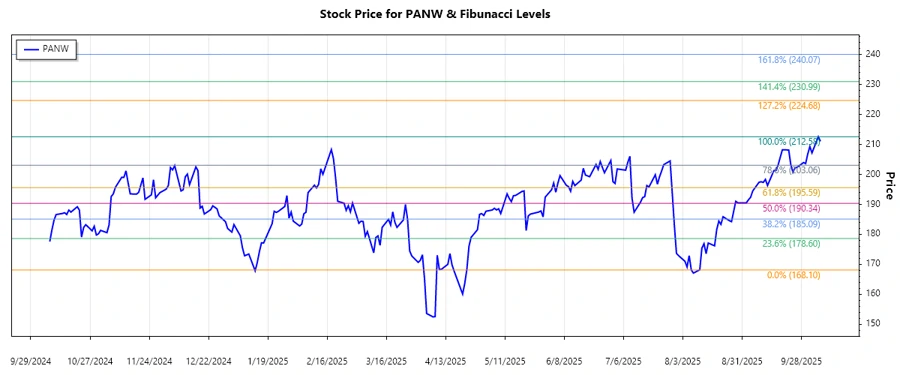
The stock of Palo Alto Networks, Inc. has exhibited a noteworthy upward trend over the last several months, driven by strong demand for its cybersecurity solutions. The technical indicators point towards continued strength, although some resistance has been encountered at higher levels. Investors should closely observe the Fibonacci retracement levels to assess potential pullbacks.
Fibonacci Analysis
| Detail | Information | ||||||||||||
|---|---|---|---|---|---|---|---|---|---|---|---|---|---|
| Trend Start Date | 2025-08-07 | ||||||||||||
| Trend End Date | 2025-10-07 | ||||||||||||
| High Point (Date) | 2025-10-06 | ||||||||||||
| High Point (Price) | 212.58 | ||||||||||||
| Low Point (Date) | 2025-08-07 | ||||||||||||
| Low Point (Price) | 168.1 | ||||||||||||
| Fibonacci Levels |
|
||||||||||||
| Current Price Retracement Zone | 0.618 | ||||||||||||
| Technical Interpretation | The stock is finding support at the 0.618 Fibonacci level, indicating potential for continuation upward. |
Conclusion
The recent upward trend in PANW stock reflects robust market confidence in Palo Alto Networks' cybersecurity offerings. The current position within the 0.618 retracement level suggests a possible rebound and further ascent, although vigilance is advised as market conditions could shift. Analysts should monitor any breakout beyond the recent high to confirm a continuing bullish trajectory or identify resistance necessitating caution. The potential risks include market sentiment changes or unforeseen competitive pressures impacting stock momentum.
Smart Data Insight
Master the Perfect Entry & Exit for this Stock
Don't leave your profits to chance. Historically, this stock follows specific seasonal patterns that institutional traders use to maximize returns.
- ✅ Identify the "Golden Buying Window"
- ✅ Avoid high-risk correction cycles
- ✅ Backtested data from the last 20+ years