
July 17, 2026 a 03:15 pm
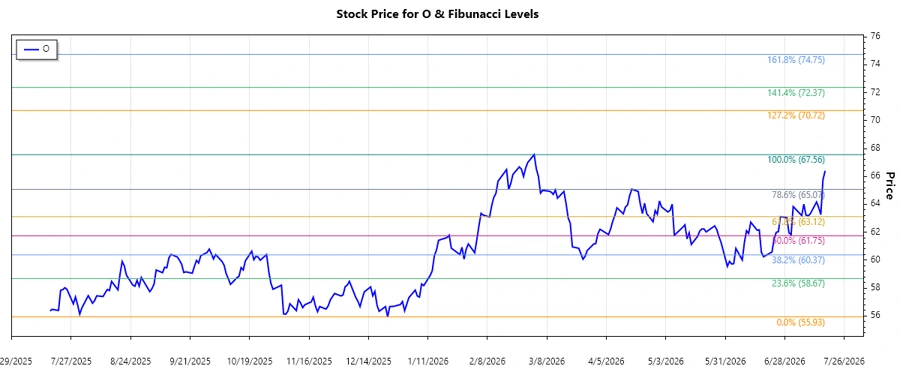
O: Fibonacci Analysis - Realty Income Corporation
Realty Income Corporation, known for its consistent monthly dividends, presents a promising profile for income-focused investors. The technical analysis indicates a recent upward trend, hinting at potential buy opportunities, especially for those seeking long-term, stable yields. Investors should consider market dynamics and broader economic factors which might impact real estate significantly in the upcoming quarters.
Fibonacci Analysis
| Detail | Information |
|---|---|
| Trend Start Date | 2025-12-23 |
| Trend End Date | 2026-07-17 |
| High Point (Price & Date) | $67.56 on 2026-03-02 |
| Low Point (Price & Date) | $55.93 on 2025-12-23 |
| 0.236 Retracement Level | $58.73 |
| 0.382 Retracement Level | $60.77 |
| 0.5 Retracement Level | $61.745 |
| 0.618 Retracement Level | $63.155 |
| 0.786 Retracement Level | $64.935 |
| Current Price | $66.4 |
| Retracement Zone | None |
| Interpretation | The current price is above the 0.786 Fibonacci level, suggesting the previous resistance might turn into a support for ongoing upward momentum. |
Conclusion
Realty Income has experienced a strong upward trend, likely reflecting positively on investor sentiment towards its stable dividend payouts. Despite macroeconomic uncertainties, its position within the real estate sector offers resilience. However, investors should remain cautious of potential interest rate hikes and fluctuations in property markets. The current technical outlook points to a solid foundation with potential support levels that could reinforce price stability.
Smart Data Insight
Master the Perfect Entry & Exit for this Stock
Don't leave your profits to chance. Historically, this stock follows specific seasonal patterns that institutional traders use to maximize returns.
- ✅ Identify the "Golden Buying Window"
- ✅ Avoid high-risk correction cycles
- ✅ Backtested data from the last 20+ years