
June 29, 2026 a 03:15 pm
O: Fibonacci Analysis - Realty Income Corporation
Realty Income Corporation, known as 'The Monthly Dividend Company,' has demonstrated a consistent ability to generate reliable monthly income for its shareholders. Over the past months, the stock has experienced a significant trend, predominantly characterized by a consistent price movement. As a part of this analysis, we focus on identifying key levels to watch for potential price retracements. This analysis aims to provide insights into critical price levels where the stock may find support or face resistance in the future.
Fibonacci Analysis
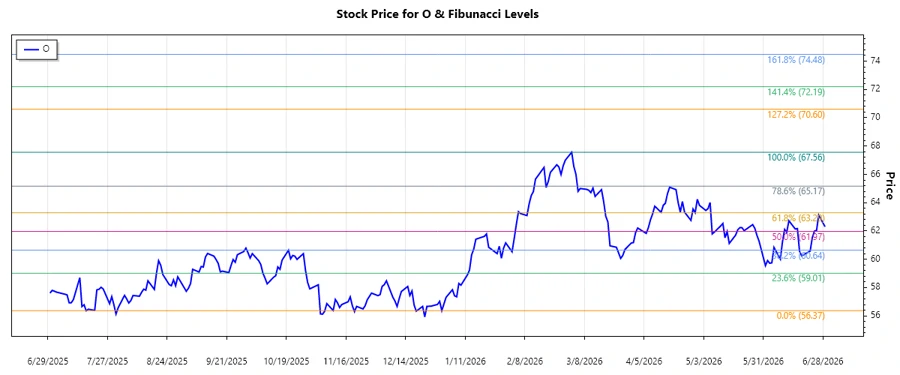
The most recent dominant trend observed in the Realty Income Corporation (Ticker: O) stock data is an uptrend. Analysis of this uptrend, from its beginning to its highest point, provides crucial insights into potential retracement levels where the stock might experience support or resistance.
| Metric | Details |
|---|---|
| Trend Period | 2026-01-02 to 2026-06-29 |
| High Point | $67.56 on 2026-02-02 |
| Low Point | $56.37 on 2025-12-31 |
| Fibonacci Levels |
|
| Current Price | $62.3 (Near 0.5 Fibonacci Level) |
| Technical Interpretation | The current price is near the 0.5 Fibonacci retracement level, indicating a potential support zone where the stock might consolidate or reverse its downtrend. |
Conclusion
Analyzing the Realty Income Corporation stock through its recent uptrend presents key opportunities and risks for investors. The proximity to significant Fibonacci retracement levels such as 0.5 highlights potential areas for strong support, which may attract buyers if the broader market conditions remain supportive. However, should the stock breach these levels decisively, it could signal deeper corrections. Given Realty Income Corp's solid track record in delivering uninterrupted dividends, the stock remains an attractive proposition for income-focused investors. As always, it's crucial for market participants to remain vigilant and incorporate broader macroeconomic factors and company-specific fundamentals into their analyses for a well-rounded investment strategy.
Smart Data Insight
Master the Perfect Entry & Exit for this Stock
Don't leave your profits to chance. Historically, this stock follows specific seasonal patterns that institutional traders use to maximize returns.
- ✅ Identify the "Golden Buying Window"
- ✅ Avoid high-risk correction cycles
- ✅ Backtested data from the last 20+ years