May 04, 2026 a 11:44 am
O: Fibonacci Analysis - Realty Income Corporation
Realty Income Corporation (NYSE: O) has consistently provided dependable monthly dividends to its stockholders by leveraging its expansive portfolio of over 6,500 real estate properties. The company's robust cash flow has enabled it to sustain and increase dividends over the years. With a member status in the S&P 500 Dividend Aristocrats index, Realty Income remains attractive to income-focused investors. However, market fluctuations can affect its performance. An analysis of the recent trends and Fibonacci retracement could provide insight into future price movements.
Fibonacci Analysis
| Details | Information |
|---|---|
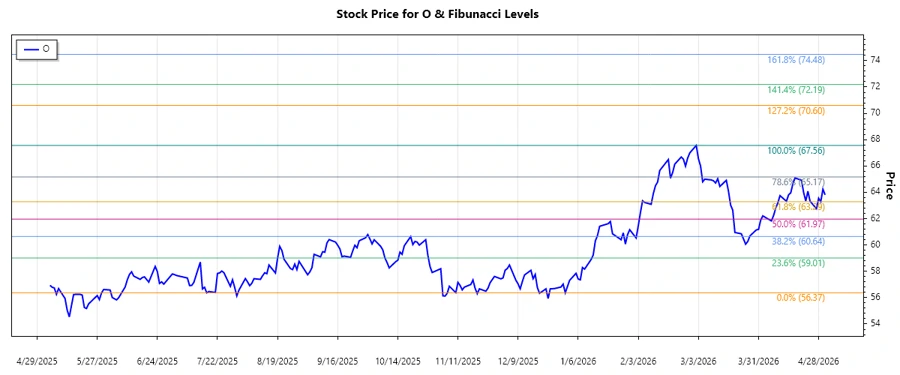
| Trend Period | 2025-10-30 to 2026-04-25 |
| Highest Price | $67.56 on 2026-03-02 |
| Lowest Price | $56.37 on 2025-12-31 |
| Fibonacci Level | Price |
|---|---|
| 0.236 | $59.37 |
| 0.382 | $61.30 |
| 0.5 | $62.97 |
| 0.618 | $64.64 |
| 0.786 | $66.54 |
The current price of $63.81 is in the 0.5 Fibonacci retracement zone. This indicates a potential support level in an ongoing uptrend, suggesting that the stock may continue its upward trajectory. In technical analysis, this level is often seen as a point where price action might reverse or continue the prevailing trend.
Conclusion
Realty Income Corporation's stock has shown a strong uptrend with a significant high at $67.56 and low at $56.37. The Fibonacci analysis highlights key levels that could serve as critical support or resistance points. Being positioned currently in the 0.5 retracement zone indicates a balance between buyers and sellers. Investors should watch for further movement above the 0.618 level to confirm continued bullish momentum or a potential reversal at 0.5. Overall, given its dependable dividends and strong real estate portfolio, the stock presents a favorable outlook, although market conditions could alter its path.
Smart Data Insight
Master the Perfect Entry & Exit for this Stock
Don't leave your profits to chance. Historically, this stock follows specific seasonal patterns that institutional traders use to maximize returns.
- ✅ Identify the "Golden Buying Window"
- ✅ Avoid high-risk correction cycles
- ✅ Backtested data from the last 20+ years