February 04, 2026 a 10:15 am
O: Fibonacci Analysis - Realty Income Corporation
Realty Income Corporation (Ticker: O), known as The Monthly Dividend Company, is a reliable choice for investors seeking consistent monthly income, thanks to its REIT structure. With a historical track of over 608 monthly dividends and being a member of the S&P 500 Dividend Aristocrats index, it represents stability and reliability. Evaluating its historical price data provides insights into future support and resistance levels.
Fibonacci Analysis
| Aspect | Details | ||||||||||||
|---|---|---|---|---|---|---|---|---|---|---|---|---|---|
| Start Date | 2025-02-04 | ||||||||||||
| End Date | 2026-02-03 | ||||||||||||
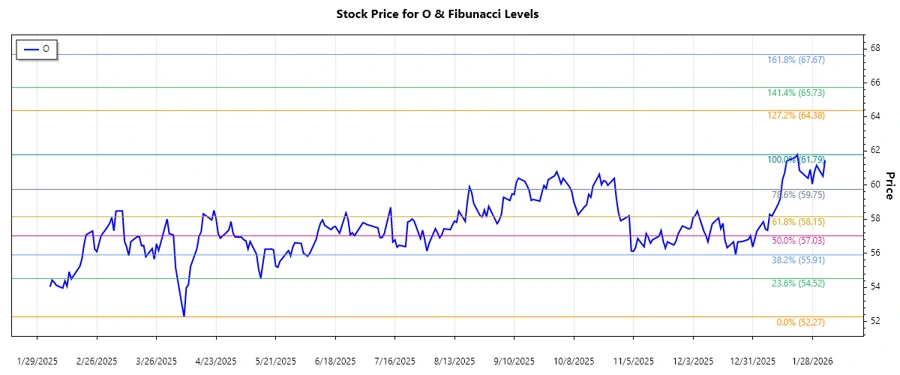
| High Price | $61.79 on 2026-01-21 | ||||||||||||
| Low Price | $52.27 on 2025-04-08 | ||||||||||||
| Fibonacci Levels |
|
||||||||||||
| Current Price Level | $61.46 is above the Fibonacci range | ||||||||||||
| Interpretation | The stock recently broke above resistance level at 61.79, and the potential to find support at $59.84 exists if prices reverse. |
Conclusion
The Realty Income Corporation has shown a dominant uptrend over the last months, characterized by a recent break over the resistance level. The stock's position above the Fibonacci levels indicates strong bullish momentum. Investors might consider current price levels for entry, anticipating further rises, but should beware of potential downward retracement to established support levels. The analysis suggests that entry points could be optimal above the $59.84 level, providing a decent risk-reward ratio, with a watchful eye on price dynamics around $58.69 and $57.86 for potential buying opportunities if prices correct.