August 20, 2025 a 05:15 am

O: Fibonacci Analysis - Realty Income Corporation
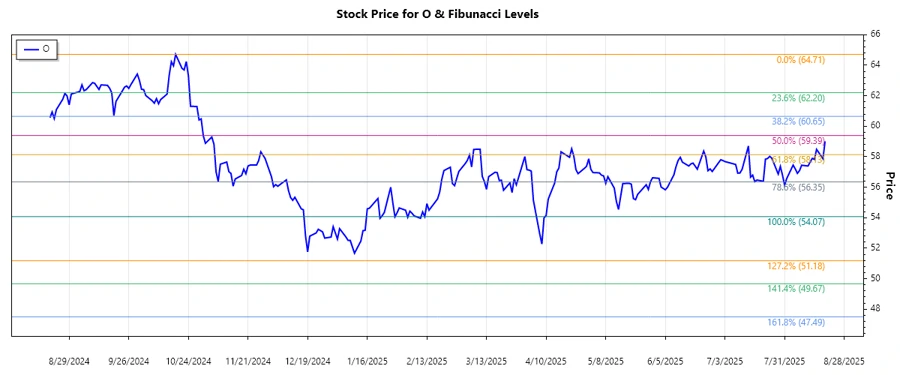
The Realty Income Corporation has demonstrated a resilient trend even amid market fluctuations, largely supported by its robust business model as a REIT with stable, long-term lease agreements. This analysis focuses on the recent trend observed in their stock price, which suggests potential investment opportunities based on technical analysis through Fibonacci retracements.
Fibonacci Analysis
| Analysis Detail | Value |
|---|---|
| Trend Start Date | 2024-08-20 |
| Trend End Date | 2025-08-19 |
| High Price | $64.71 (2024-10-18) |
| Low Price | $54.07 (2025-02-12) |
| Fibonacci Level (0.236) | $56.57 |
| Fibonacci Level (0.382) | $58.11 |
| Fibonacci Level (0.5) | $59.39 |
| Fibonacci Level (0.618) | $60.67 |
| Fibonacci Level (0.786) | $62.43 |
| Current Price | $59.01 |
| Retracement Zone | 0.5 |
The current price of $59.01 is within the 0.5 Fibonacci retracement zone, which typically acts as a key support or resistance level. This indicates that the stock might be at a critical point where a reversal could occur if upward momentum is maintained.
Conclusion
The technical analysis through Fibonacci retracement presents a scenario where Realty Income Corporation's stock is at a noteworthy phase. The stock's position in the 0.5 retracement zone suggests a potential support point which could bolster further upward momentum if investor sentiment persists positively. Real estate fundamentals continue to provide a firm base for dividend stability. However, should the stock fall beneath the 0.618 level, it might indicate increasing bearish sentiment. Monitoring macroeconomic conditions and market liquidity is crucial to assess potential risks effectively.
Smart Data Insight
Master the Perfect Entry & Exit for this Stock
Don't leave your profits to chance. Historically, this stock follows specific seasonal patterns that institutional traders use to maximize returns.
- ✅ Identify the "Golden Buying Window"
- ✅ Avoid high-risk correction cycles
- ✅ Backtested data from the last 20+ years